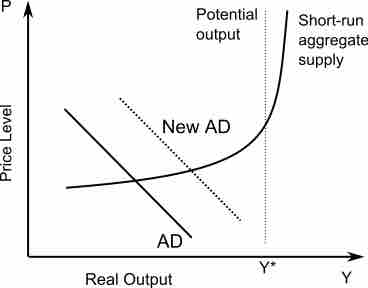
AD-AS Model
This graph shows the AD-AS model where P is the average price level and Y* is the aggregate quantity demanded. The model is used to show how increases in aggregate demand leads to increases in prices (inflation) and in output.
Source
Boundless vets and curates high-quality, openly licensed content from around the Internet. This particular resource used the following sources: