Investment assets are typically characterized as having two performance risks: systematic (or market risk) and non-systematic risk. Systematic risk arises from market structure or dynamics, which produce shocks or uncertainty faced by all agents in the market. Non-systematic risk is unique to a specific company and can be reduced through diversification.
Capital Asset Pricing Model (CAPM)
In finance, the capital asset pricing model (CAPM) is used to determine the required rate of return of an asset, taking into account an asset's sensitivity to non-diversifiable or systematic risk. Non-diversifiable risk is noted by the variable beta (β), where beta is greater than one if the asset's price sensitivity is greater than the market; equal to one when the asset's sensitivity is equal to the market; and less than one if the asset exhibits less pricing volatility than the market.
The CAPM is a model for pricing an individual security or portfolio. The expected return of an asset is equal to the risk free rate plus the excess return of the market above the risk-free rate, adjusted for the asset's overall sensitivity to market fluctuations or its beta. Mathematically, the capital asset pricing model can be written as: E(Ri) = Rf + β(E(Rm) - Rf), where R is the return, E(R) is the expected return, i denotes any asset, f is the risk-free asset, and m is the market.
Security Market Line (SML)
For individual securities, the security market line (SML) and its relation to expected return and systematic risk (beta) depicts an individual security in relation to their security risk class . The SML essentially graphs the results from the capital asset pricing model formula. The x-axis represents the risk (beta), and the y-axis represents the expected return. The market risk premium is determined from the slope of the SML. The relationship between β and required return is plotted on the SML, which shows expected return as a function of β. The intercept is the nominal risk-free rate available for the market, while the slope is the market premium, E(Rm)− Rf.
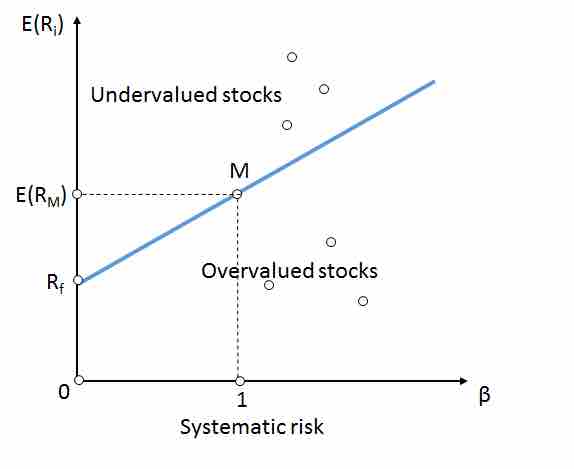
Security market line
The security market line depicts the the return on a security relative to its own risk.
The SML is a useful tool in determining if an asset being considered for a portfolio offers a reasonable expected return for risk. Individual securities are plotted on the SML graph. If the security's expected return versus risk is plotted above the SML, it is undervalued since the investor can expect a greater return for the inherent risk. A security plotted below the SML is overvalued since the investor would be accepting a smaller return for the amount of risk assumed.