Technology and Market Share
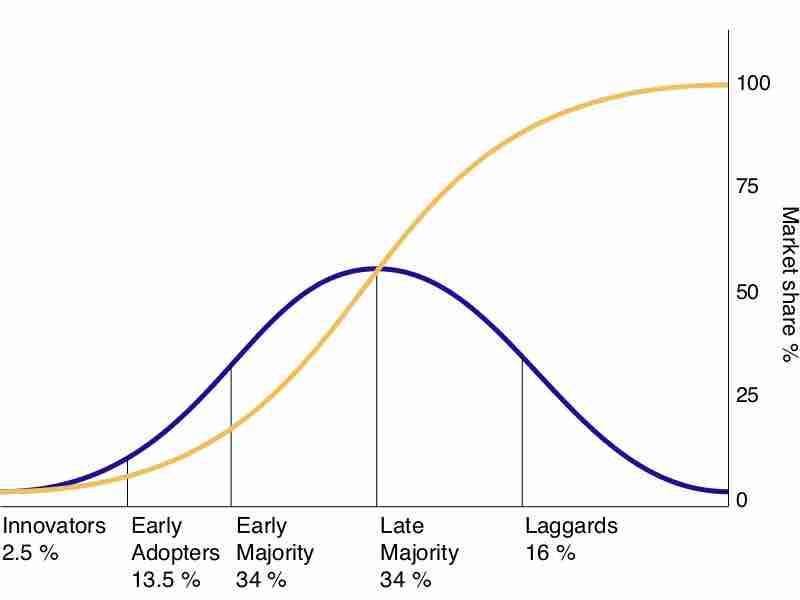
As successive groups of consumers adopt new technology a bell curve emerges - this is referred to as the innovation adoption life cycle (the blue bell curve on the above graphic). The percentages on the x-axis indicate the size of the populations (relative to the entire consumer group for a given good) in each segment. By keeping pace with technological innovation, and offering products early enough to capture the majority of the market, businesses can gain competitive advantage. If a business is too late to enter a newly emerged technological market, it can be quite difficult to attain a high percentage of the market share, as represented on the y-axis (which has often been claimed by other incumbents, as the intersecting yellow line on the graph indicates).
Source
Boundless vets and curates high-quality, openly licensed content from around the Internet. This particular resource used the following sources: