Concept
Version 9
Created by Boundless
Generation Time

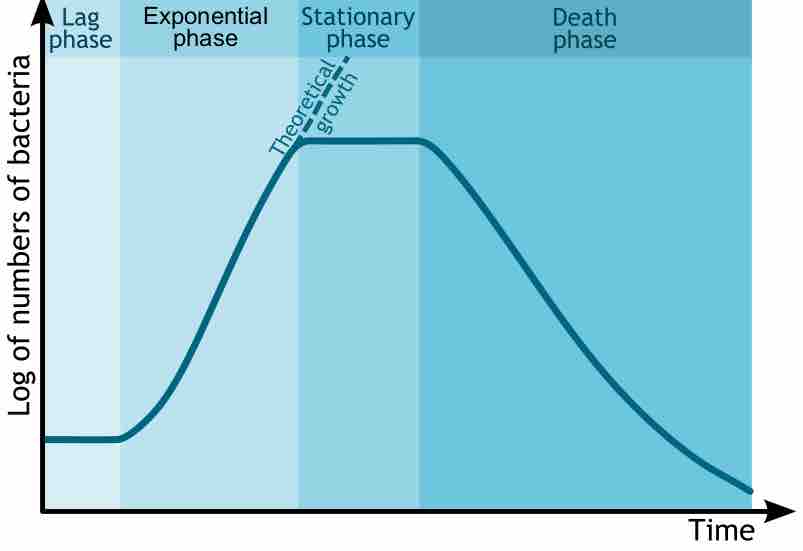
Bacterial Growth Curve
This chart shows the logarithmic growth of bacteria. Note the Y-axis scale is logarithmic meaning that the number represents doubling. The phases of growth are labelled on top.
Source
Boundless vets and curates high-quality, openly licensed content from around the Internet. This particular resource used the following sources: