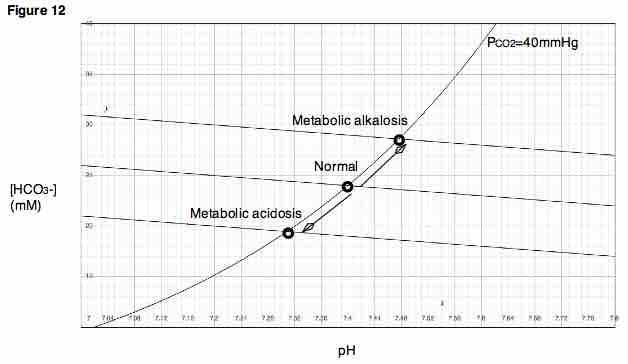
Davenport Diagram
A Davenport Diagram, as shown, is a graphical tool developed by Allan Jones Davenport that allows a clinician or investigator to describe blood bicarbonate concentrations and blood pH following a respiratory and/or metabolic acid-base disturbance.
Source
Boundless vets and curates high-quality, openly licensed content from around the Internet. This particular resource used the following sources: