Cardiac output (CO) is a measure of the heart's performance. While there are many clinical techniques to measure CO, it is best described as a physiological and mathematical relationship between different variables. When one of the variables change, CO as a whole will change as a result. This can also be used to predict other regulated variables, such as blood pressure and blood volume. The mathematical description of CO is that CO=Heart Rate (HR) X Stroke Volume (SV). Changes in HR, SV, or their components, will change CO.
Heart Rate
The heart rate is determined by spontaneous action potential generation in the sinoatrial (SA) node and conduction in the atrioventricular (AV) node. It refers to the number of heartbeats over the course of a minute. Sympathetic nervous system activation will stimulate the SA and AV nodes to increase the heart rate, which will increase cardiac output. Parasympathetic nervous system activation will conversely act on the SA and AV nodes to decrease the heart rate, which will decrease cardiac output. For the SA node, the rate of depolarization is altered, while the AV node's rate of conduction is altered by autonomic nerve stimulation.
Stroke Volume
Stroke volume refers to the amount of blood ejected from the heart during a single beat. It is a measure of the contractility of the heart based on end diastolic volume (EDV), mathematically described as SV=EDV-ESV (end systolic volume). EDV is the volume of blood in the ventricles at the end of diastole, while ESV is the volume of blood left inside the ventricles at the end of systole, making SV the difference between EDV and ESV. Contractility of the heart refers to the variability in how much blood the heart ejects based on changes in stroke volume rather than than changes in heart rate.
Additionally, another indicator known as the ejection fraction (EF) is used to evaluate stroke volume and contractility. It is described as EF=(SV/EDV) X 100% and is a measure of the proportion of blood ejected during systole compared to the amount of blood that was present in the heart. A higher EF suggests more efficient heart activity.
Mean Arterial Pressure
Cardiac output is an indicator of mean arterial blood pressure (MAP), the average measure of blood pressure within the body. It is described as MAP=CO X TPR (total peripheral resistance). TPR is a measure of resistance in the blood vessels, which acts as the force by which blood must overcome to flow through the arteries determined by the diameter of the blood vessels. The exact relationship is such that a twofold increase in blood vessel diameter (doubling the diameter) would decrease resistance by 16-fold, and the opposite is true as well. When CO increases, MAP will increase, but if CO decreases, MAP will decrease.
Starling's Law of the Heart
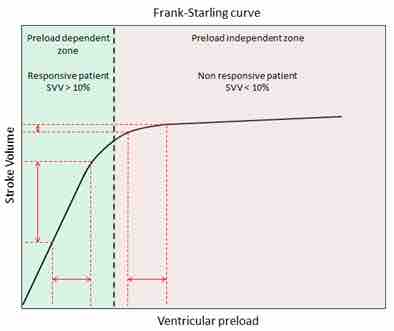
CO can also predict blood pressure based on blood volume. Starling's law of the heart states that the SV of the heart increases in response to an increase in EDV when all other factors remain constant. Essentially, this means that higher venous blood return to the heart (also called the preload) will increase SV, which will in turn increase CO. This is because sarcomeres are stretched further when EDV increases, allowing the heart to eject more blood and keep the same ESV if no other factors change.
The main implication of this law is that increases in blood volume or blood return to the heart will increase cardiac output, which will lead to an increase in MAP. The opposite scenario is true as well. For example, a dehydrated person will have a low blood volume and lower venous return to the heart, which will decrease cardiac output and blood pressure. Those that stand up quickly after lying down may feel light-headed because their venous return to the heart is momentarily impaired by gravity, temporarily decreasing blood pressure and supply to the brain. The adjustment for blood pressure is a quick process, while blood volume is slowly altered. Blood volume itself is another regulated variable, regulated slowly through complex processes in the renal system that alter blood pressure based on the Starling mechanism.

Frank Starling's Law
This chart indicates stroke volume compared to ventricular preload, with labels for preload dependent zone, responsive patient SVV > 10%, and nonresponsive patient SVV < 10 %.