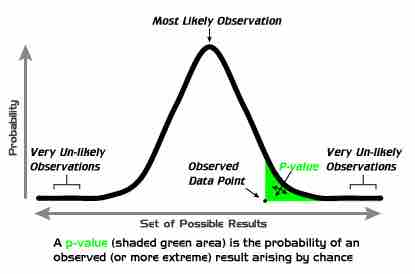
Statistical significance refers to two separate notions: the p-value (the probability that the observed data would occur by chance in a given single null hypothesis); or the Type I error rate α (false positive rate) of a statistical hypothesis test (the probability of incorrectly rejecting a given null hypothesis in favor of a second alternative hypothesis).
A fixed number, most often 0.05, is referred to as a significance level or level of significance; such a number may be used either in the first sense, as a cutoff mark for p-values (each p-value is calculated from the data), or in the second sense as a desired parameter in the test design (α depends only on the test design, and is not calculated from observed data). In this atom, we will focus on the p-value notion of significance.
What is Statistical Significance?
Statistical significance is a statistical assessment of whether observations reflect a pattern rather than just chance. When used in statistics, the word significant does not mean important or meaningful, as it does in everyday speech; with sufficient data, a statistically significant result may be very small in magnitude.
The fundamental challenge is that any partial picture of a given hypothesis, poll, or question is subject to random error. In statistical testing, a result is deemed statistically significant if it is so extreme (without external variables which would influence the correlation results of the test) that such a result would be expected to arise simply by chance only in rare circumstances. Hence the result provides enough evidence to reject the hypothesis of 'no effect'.
For example, tossing 3 coins and obtaining 3 heads would not be considered an extreme result. However, tossing 10 coins and finding that all 10 land the same way up would be considered an extreme result: for fair coins, the probability of having the first coin matched by all 9 others is rare. The result may therefore be considered statistically significant evidence that the coins are not fair.
The calculated statistical significance of a result is in principle only valid if the hypothesis was specified before any data were examined. If, instead, the hypothesis was specified after some of the data were examined, and specifically tuned to match the direction in which the early data appeared to point, the calculation would overestimate statistical significance.
Use in Practice
Popular levels of significance are 10% (0.1), 5% (0.05), 1% (0.01), 0.5% (0.005), and 0.1% (0.001). If a test of significance gives a p-value lower than or equal to the significance level , the null hypothesis is rejected at that level. Such results are informally referred to as 'statistically significant (at the p = 0.05 level, etc.)'. For example, if someone argues that "there's only one chance in a thousand this could have happened by coincidence", a 0.001 level of statistical significance is being stated. The lower the significance level chosen, the stronger the evidence required. The choice of significance level is somewhat arbitrary, but for many applications, a level of 5% is chosen by convention.

P-Values
A graphical depiction of the meaning of p-values.
Different levels of cutoff trade off countervailing effects. Lower levels – such as 0.01 instead of 0.05 – are stricter, and increase confidence in the determination of significance, but run an increased risk of failing to reject a false null hypothesis. Evaluation of a given p-value of data requires a degree of judgment, and rather than a strict cutoff, one may instead simply consider lower p-values as more significant.