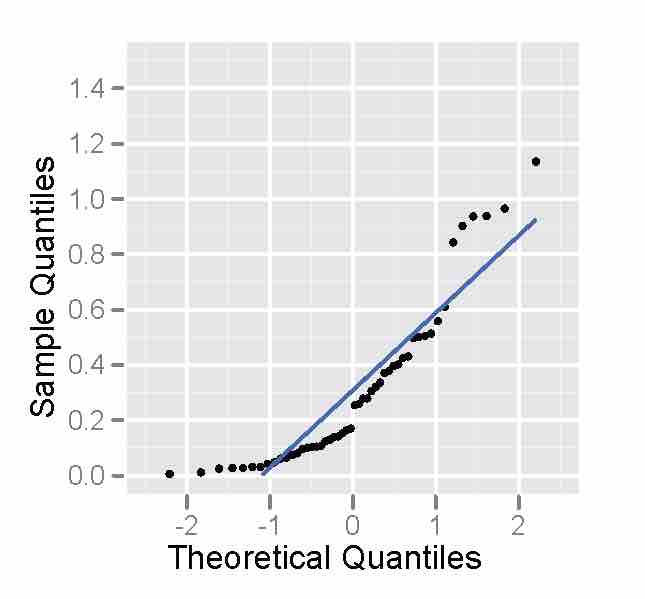
Non-Normality - Probability Plot
This is a sample of size 50 from a right-skewed distribution, plotted as a normal probability plot. Notice that the points deviate on the, indicating the distribution is not normal.
Source
Boundless vets and curates high-quality, openly licensed content from around the Internet. This particular resource used the following sources: