A continuous probability distribution is a representation of a variable that can take a continuous range of values.

The continuous uniform distribution is a family of symmetric probability distributions in which all intervals of the same length are equally probable.
The exponential distribution is a family of continuous probability distributions that describe the time between events in a Poisson process.
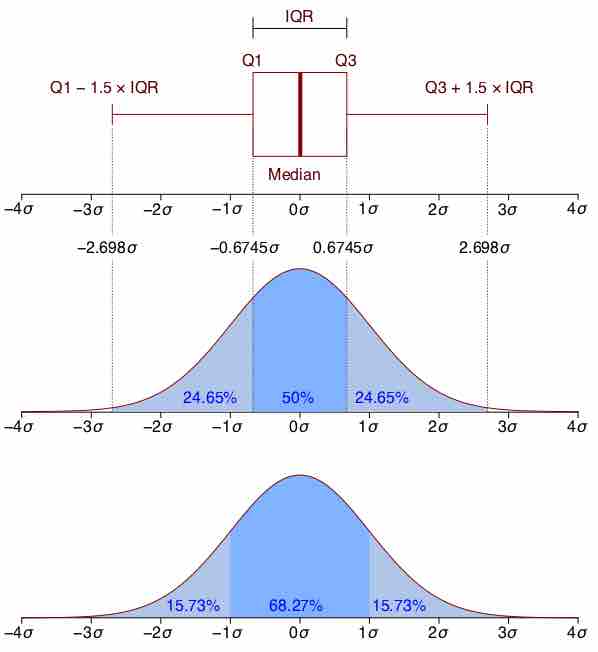
The normal distribution is symmetric with scores more concentrated in the middle than in the tails.
The graph of a normal distribution is a bell curve.
The standard normal distribution is a normal distribution with a mean of 0 and a standard deviation of 1.
To calculate the probability that a variable is within a range in the normal distribution, we have to find the area under the normal curve.