Correlation refers to any of a broad class of statistical relationships involving dependence.
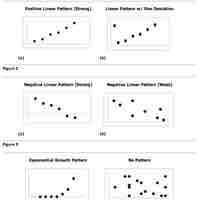
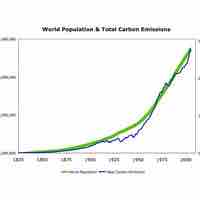
A scatter diagram is a type of mathematical diagram using Cartesian coordinates to display values for two variables in a set of data.
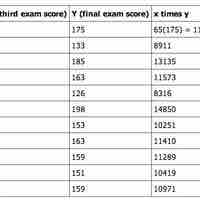
The correlation coefficient is a measure of the linear dependence between two variables
The coefficient of determination provides a measure of how well observed outcomes are replicated by a model.
The trend line (line of best fit) is a line that can be drawn on a scatter diagram representing a trend in the data.
Other types of correlation coefficients include intraclass correlation and the concordance correlation coefficient.
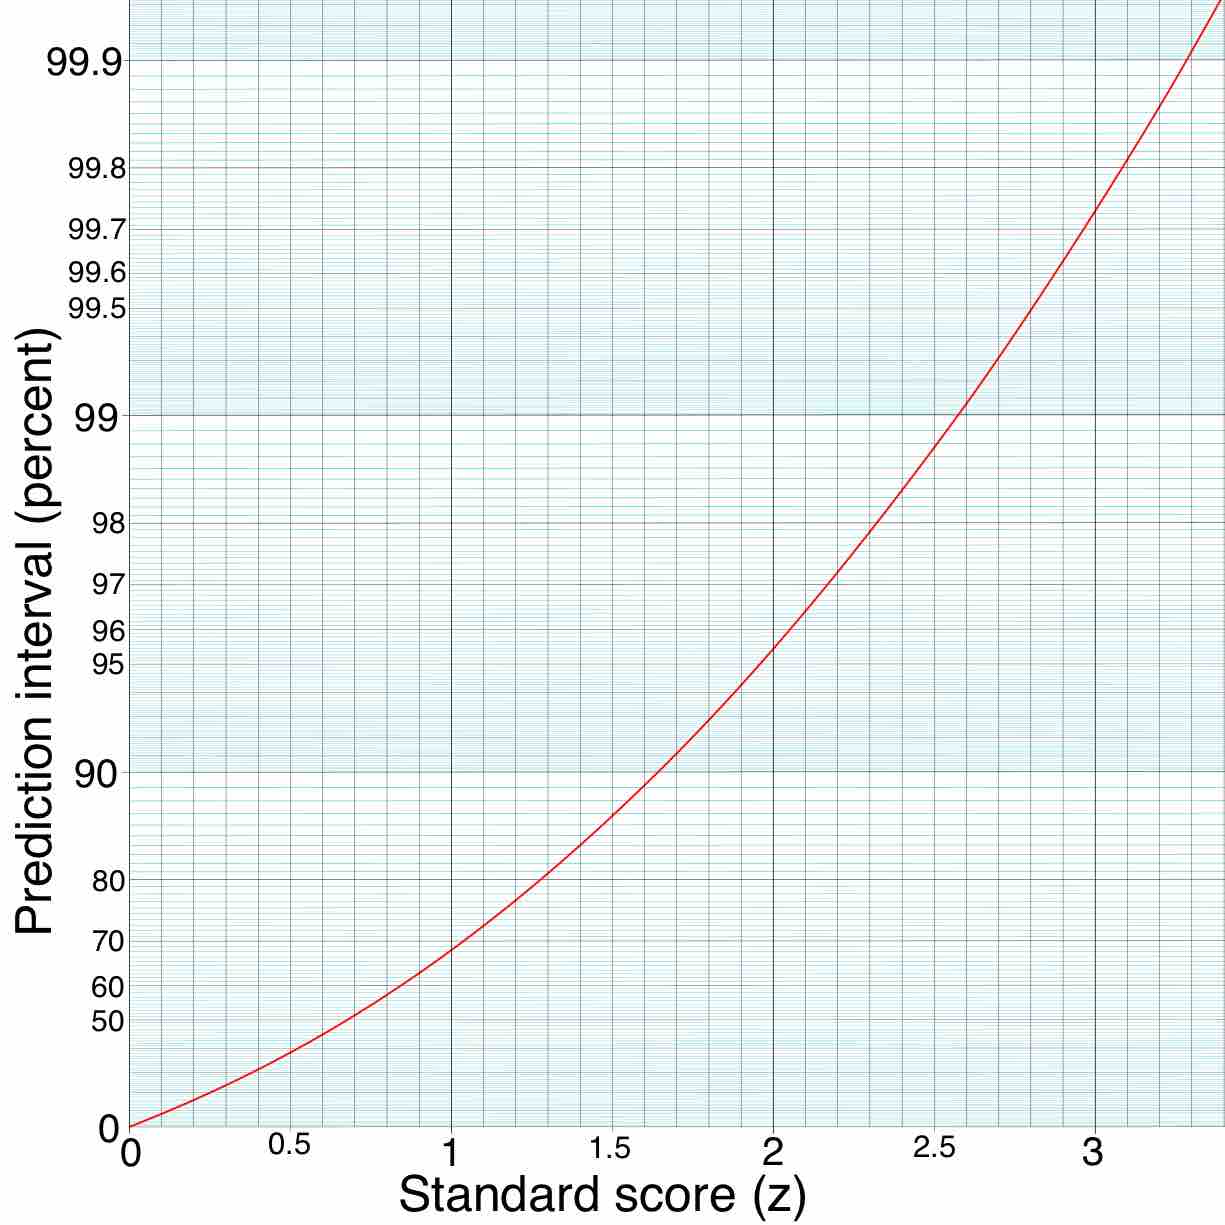
A prediction interval is an estimate of an interval in which future observations will fall with a certain probability given what has already been observed.
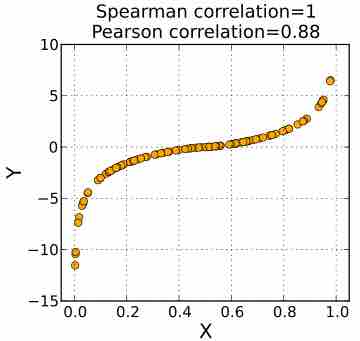
A rank correlation is a statistic used to measure the relationship between rankings of ordinal variables or different rankings of the same variable.