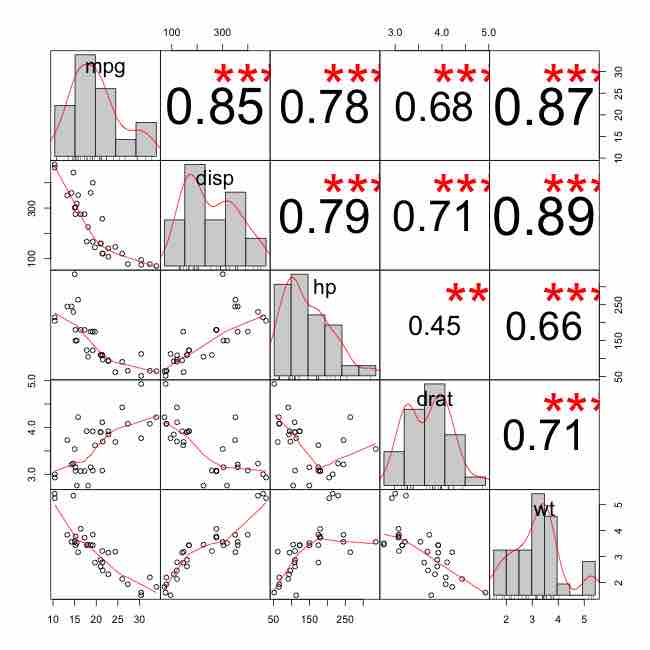
Matrix Correlation Plot
This figure shows a very nice scatterplot matrix, with histograms, kernel density overlays, absolute correlations, and significance asterisks (0.05, 0.01, 0.001).
Source
Boundless vets and curates high-quality, openly licensed content from around the Internet. This particular resource used the following sources:
"Getting Genetics Done: More on Exploring Correlations in R."
http://gettinggeneticsdone.blogspot.com/2012/08/more-on-exploring-correlations-in-r.html
Blogspot
CC BY-SA.