The importance of data distribution in linear regression inference
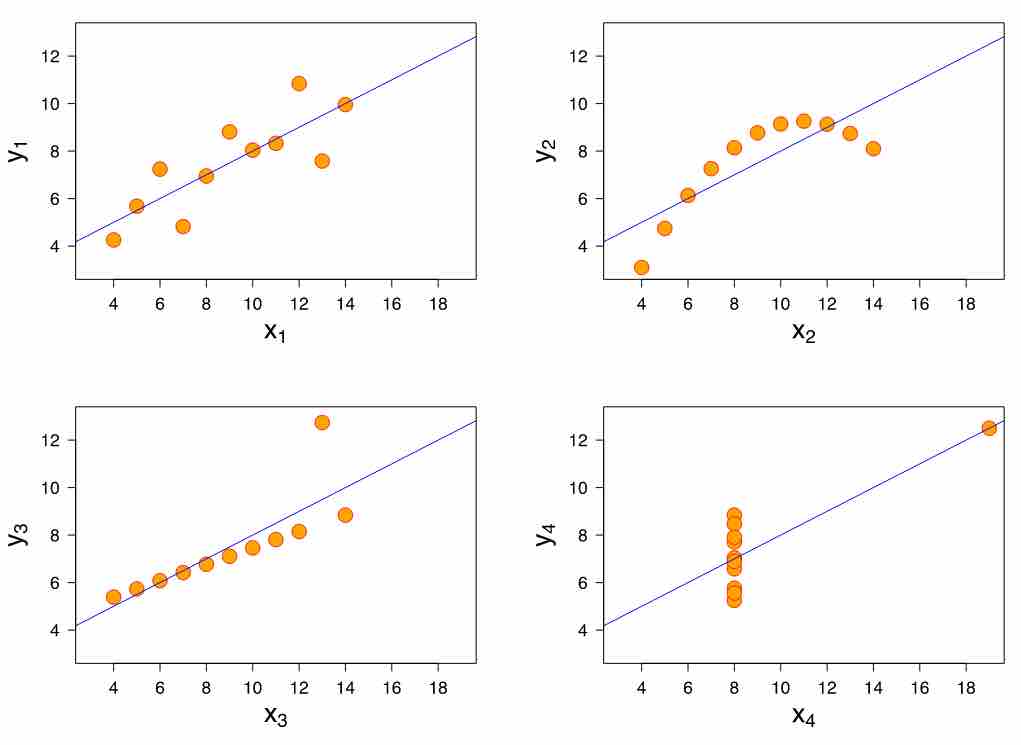
A good rule of thumb when using the linear regression method is to look at the scatter plot of the data. This graph is a visual example of why it is important that the data have a linear relationship. Each of these four data sets has the same linear regression line and therefore the same correlation, 0.816. This number may at first seem like a strong correlation—but in reality the four data distributions are very different: the same predictions that might be true for the first data set would likely not be true for the second, even though the regression method would lead you to believe that they were more or less the same. Looking at panels 2, 3, and 4, you can see that a straight line is probably not the best way to represent these three data sets.
Source
Boundless vets and curates high-quality, openly licensed content from around the Internet. This particular resource used the following sources: