Task 3: Key Concepts about Checking for Data Symmetry
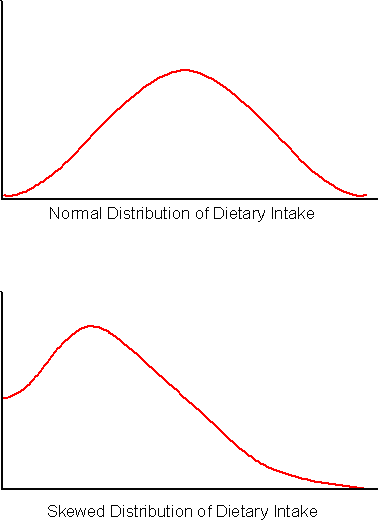
An underlying assumption in many statistical analyses is that the distribution of the data is normal. However, as shown in the figure below, almost all distributions of dietary data tend to be skewed. For many dietary constituents, a large number of persons may have zero intakes and a few people may have very large intakes.
Figure 1. Hypothetical distributions of dietary intake in the population

These distributional characteristics are especially important when estimating the distribution of usual intakes. Skewness does not affect simple analyses such as those described in the Basic Dietary Analysis Course. Therefore, no special corrections are necessary to estimate means of usual intake distributions and statistics based on those means, such as differences between population subgroups. However, for more complex analyses, such as those described in the Advanced Dietary Analyses course, skewness must be taken into account. For more information on this topic, please see the Advanced Dietary Analyses course.
![]() Close Window
to return to module page.
Close Window
to return to module page.