

/en/excel2003/editing-charts/content/
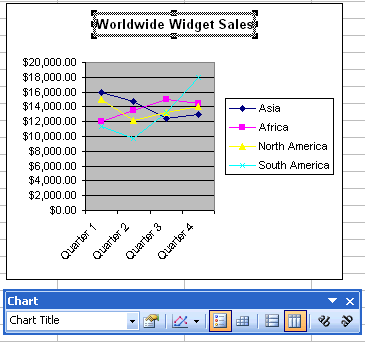
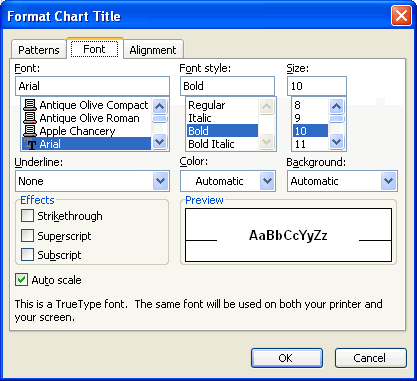
The chart title can be formatted to change color, pattern, typeface, size, and alignment using the Format Chart Title dialog box.

The chart legend displays useful information about the chart. Like a roadmap, the legend identifies what different colors or objects represent in the chart. The chart legend, like the chart title and category axis labels, can be formatted to your liking.
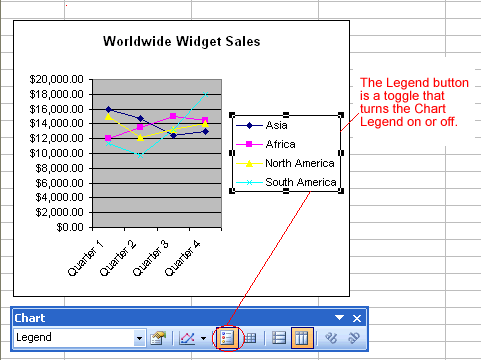

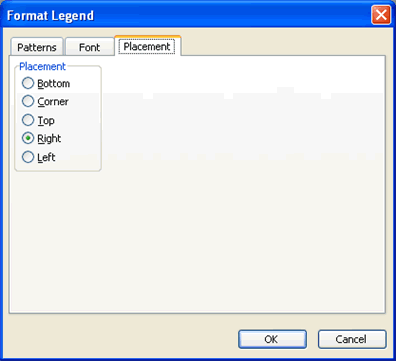
 The only way to change the actual text that appears in the chart legend is to change the source data in the worksheet.
We've previously made reference to a Y axis and an X axis in Excel. In Excel, a graph represents a data in two dimensions. The number of items sold in January is data on two dimensions: number of items and month. The number of items might be plotted on the Y axis, while the month may be plotted on the X axis. The Y axis runs up and down on the graph, while the X axis runs left to right.
When formatting the axis labels in your chart, you can adjust the numbers on the scale of the chart, as well as change font, color, and style.
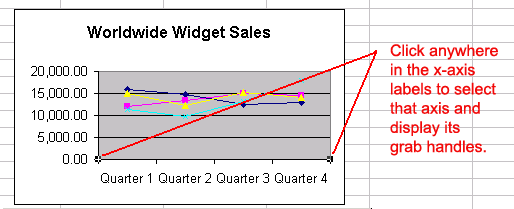
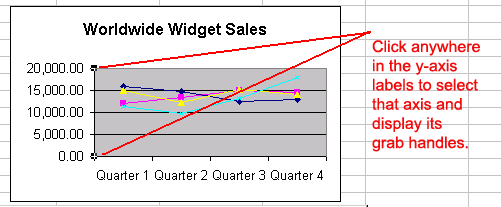

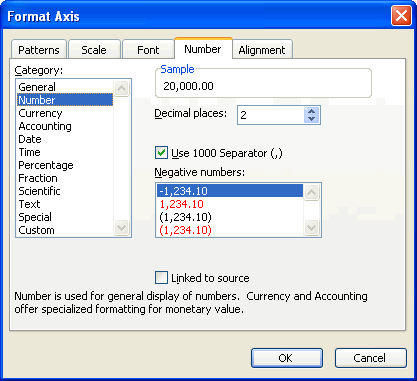
 You can also use the angle axis buttons on the chart toolbar to change the angle of the value and category axis.
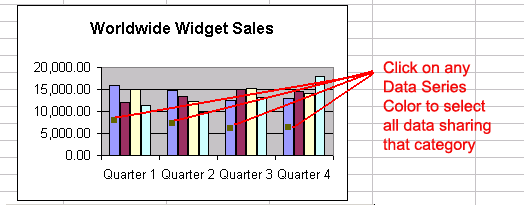
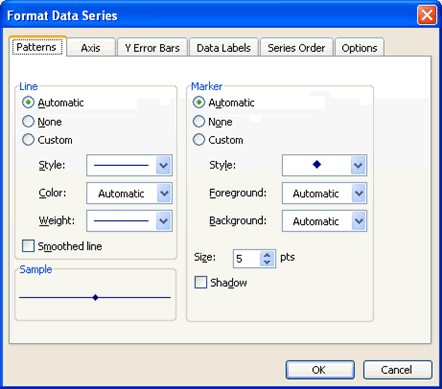
When a chart is created in Excel 2003, you'll notice that color is automatically applied to the data series. You can keep this format or change it for each data series in the chart. Many different aspects of each data series can be changed, but you'll probably change the color of bars, columns, pie slices, and areas most often.

/en/excel2003/defining-page-setup-options/content/