
/en/excel2016/functions/content/
Excel workbooks are designed to store a lot of information. Whether you're working with 20 cells or 20,000, Excel has several features to help you organize your data and find what you need. You can see some of the most useful features below. And be sure to check out the other lessons in this tutorial to get step-by-step instructions for each of these features.
You may want to see certain rows or columns all the time in your worksheet, especially header cells. By freezing rows or columns in place, you'll be able to scroll through your content while continuing to view the frozen cells. In this example, we've frozen the top two rows, which allows us to view the dates no matter where we scroll in the spreadsheet.

You can quickly reorganize a worksheet by sorting your data. Content can be sorted alphabetically, numerically, and in many other ways. For example, you could organize a list of contact information by last name.

Filters can be used to narrow down the data in your worksheet, allowing you to view only the information you need. In this example, we're filtering the worksheet to show only rows that contain the words Laptop or Projector in column B.

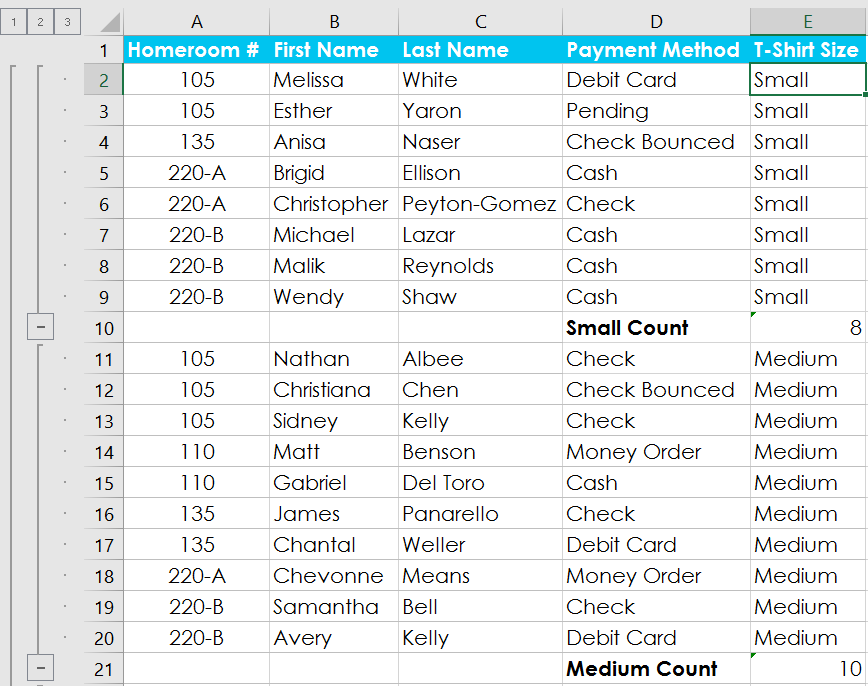
The Subtotal feature allows you to quickly summarize your data. In our example, we've created a subtotal for each T-shirt size, which makes it easy to see how many we'll need in each size.

Just like regular formatting, tables can improve the look and feel of your workbook, but they'll also help you organize your content and make your data easier to use. For example, tables have built-in sorting and filtering options. Excel also includes several predefined table styles, allowing you to create tables quickly.

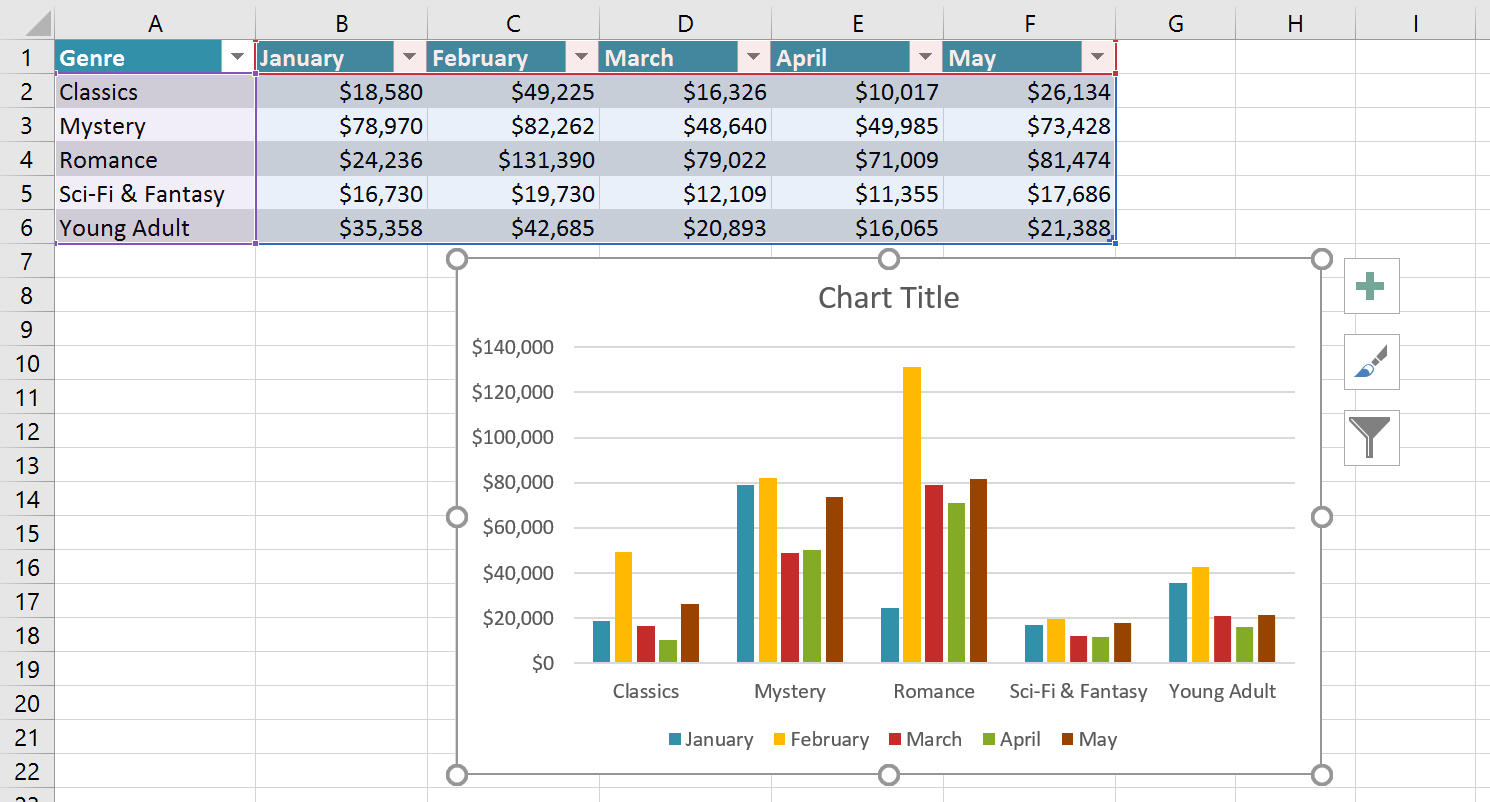
It can be difficult to interpret Excel workbooks that contain a lot of data. Charts allow you to illustrate your workbook data graphically, which makes it easy to visualize comparisons and trends.

Let's say you have a worksheet with thousands of rows of data. It would be extremely difficult to see patterns and trends just from examining the raw information. Conditional formatting allows you to automatically apply cell formatting—such as colors, icons, and data bars—to one or more cells based on the cell value.

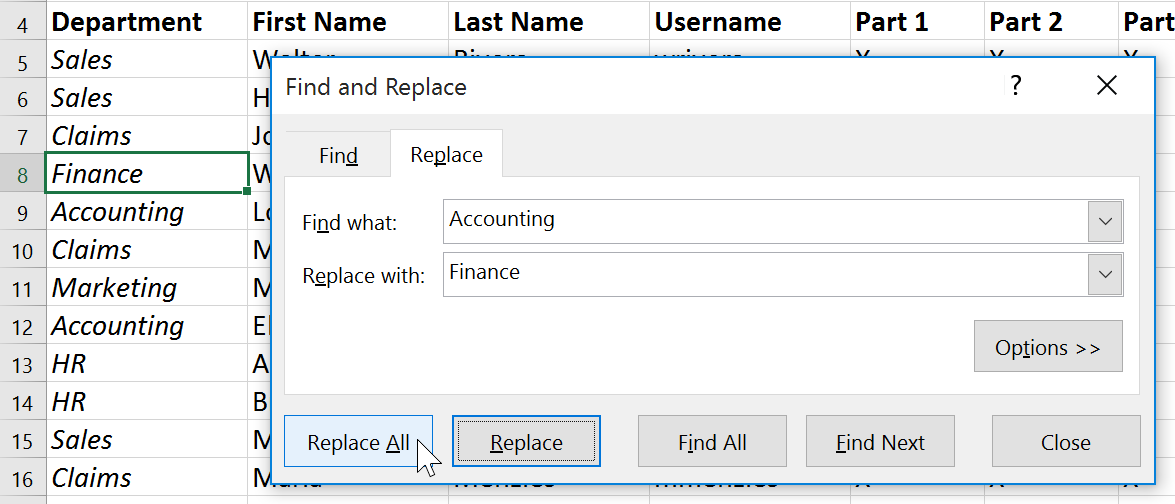
When working with a lot of data, it can be difficult and time consuming to locate specific information. You can easily search your workbook using the Find feature, which also allows you to modify content using the Replace feature.

/en/excel2016/freezing-panes-and-view-options/content/