Electrocardiogram
- Article Author:
- Yasar Sattar
- Article Editor:
- Lovely Chhabra
- Updated:
- 7/31/2020 3:58:48 PM
- For CME on this topic:
- Electrocardiogram CME
- PubMed Link:
- Electrocardiogram
Introduction
The electrocardiogram (abbreviated as ECG or EKG) represents an electrical tracing of the heart and is recorded non-invasively from the surface of the body. The word ECG derives from the German language. In German, it is elektro-kardiographie. In 1902, the Dutch physician Einthovan invented ECG, and his tremendous input in the clinical studies for about ten years led to full recognition of the clinical potential of the technique. Many arrhythmias and EKG changes associated with angina and atherosclerosis were identified by 1910. William Einthoven was named the "father of electrocardiography" and was awarded Nobel Prize in Medicine in 1924 for his hard work that laid the foundation of the most fundamental technique of investigating heart disorders. ECG was soon recognized as a robust screening and a clinical diagnostic tool, and today it is used globally in almost every healthcare setting.[1]
ECG is a non-invasive diagnostic modality that has a substantial clinical impact on investigating the severity of cardiovascular diseases.[2] ECG is increasingly being used for monitoring of patients on antiarrhythmics and other drugs, as an integral part of preoperative assessment of patients undergoing non-cardiac surgery, and for screening individuals in high-risk occupations and those who are participating in sports. Also, EKG serves as a research tool for surveillance and experimental trials of drugs with recognized cardiac effects.[3] Cardiovascular disease, as the number one cause of death, puts a great emphasis on health-care providers to develop skills and knowledge in interpreting ECGs to provide the best care promptly. Many health-care providers find the advanced interpretation of ECG findings a complicated task. Errors in the analysis can lead to misdiagnosis resulting in delaying the appropriate treatment. This activity seeks to provide a general understanding of the ECG mechanisms, interpretation techniques, and commonly encountered ECG findings.
Anatomy and Physiology
A basic understanding of cardiac anatomy and coronary distribution is essential to understand the electrocardiographic findings.
The heart is a vital organ of the body and occupies the space in the central chest between the lungs. Together with the blood vessels and blood, it constitutes the circulatory system of the body. The heart is a muscular organ comprised of four chambers that includes two atria (right and left) opening into right and left ventricles via tricuspid and mitral valves, respectively. A wall of muscle called septum separates all the four chambers. The heart receives deoxygenated blood from the whole body via superior and inferior vena cava, which first enters the right atrium. From here, it transits through the right ventricle and then passes into the lungs via right and left pulmonary arteries, where it is oxygenated. The oxygenated blood from the lungs pours into the left atrium through the right and left pulmonary veins, and from here, it is pumped by the left ventricle into the aorta to the rest of the body. The heart derives its blood supply from the coronary arteries that branch off from the aorta. The right and left coronary arteries lie on the surface of the heart. With considerable heterogeneity among the general population, different regions of the heart receive vascular supply by the various branches of the coronary arteries. This anatomic distribution is significant because these cardiac regions are assessed by a 12-lead ECG to help localize and diagnose ischemic or infarcted areas. Written below are the following regions supplied by the different coronary arteries.
- Inferior Wall - Right coronary artery
- Anteroseptal - Left anterior descending artery
- Anteroapical - Left anterior descending artery (Distal)
- Anterolateral - Circumflex artery
- Posterior Wall - Right coronary artery
The heart is a mechanical pump whose activity is governed by the electrical conduction system. It is essential to have a good understanding of the physiology of the cardiac cells as this will help the reader appreciate how the heart works and the implications of findings on the ECG. The heart is made up of specialized cardiac muscle, which is striated and organized into sarcomeres. These muscle fibers contain a single central nucleus, numerous mitochondria, and myoglobin molecules. Extensive branching of the cardiac muscle fibers and their end to end connection with each other through intercalated discs make them contract in a wave-like fashion. This mechanical work of pumping blood to the whole body occurs in a synchronized manner and is under the control of the cardiac conduction system. It is comprised of two types of cells, pacemaker and non-pacemaker cells. Pacemaker cells are located primarily in the SA and AV node, and it is the SA node, which drives the rate and rhythm of the heart. The AV node gets suppressed by the more rapid pace of the SA node. [4] The specialized function associated with the pacemaker cells is their spontaneous depolarization with no true resting potential. When spontaneous depolarization reaches the threshold voltage, it triggers a rapid depolarization followed by repolarization. The non-pacemaker cells mainly comprise the atrial and ventricular cardiac muscle cells and Purkinje fibers of the conduction system. They consist of true resting membrane potential, and upon initiation of an action potential, rapid depolarization is triggered, followed by a plateau phase and subsequent repolarization. Action potentials are generated by ion conductance via the opening and closing of the ion channels. Knowing which ECG leads corresponds to specific arteries helps in localizing the obstruction in acute ST-elevation MI or an age-indeterminate Q-wave infarction by observing predictable patterns on the ECG.[5]
Indications
The evolution of EKG from a string galvanometer to the modern-day advanced computerized machine has led to its use as a diagnostic and screening tool, making it the gold standard for diagnosing various cardiac diseases.
Owing to its widespread use in the field of medicine, the EKG has several indications listed below:
- Symptoms are the foremost indication in use for the EKG which includes palpitation, dizziness, cyanosis, chest pain, syncope, seizure, and poisoning
- Symptoms or signs associated with heart disease including tachycardia, bradycardia and clinical conditions including hypothermia, murmur, shock, hypotension, and hypertension
- To detect myocardial injury, ischemia, and the presence of prior infarction as well
- Rheumatic heart disease[6]
- EKG changes in cases like drowning and electrocution are very valuable in the determination of necessary interventions[7]
- Detecting pacemaker or defibrillator device malfunction, evaluate their programming and function, verify the analysis of arrhythmias and monitor for delivery of the appropriate electrical pacing in patients with defibrillators and pacemakers[8]
- Evaluation of metabolic disorders
- Helpful for the assessment of blunt cardiac trauma[9]
- Cardiopulmonary resuscitation
- Valuable aid in the study and differential diagnosis of congenital heart diseases[10]
- Electrolyte imbalance and rhythm disorders[11]
- To monitor the pharmacotherapeutic effects and adverse effects of drug therapy
- Perioperative anesthesia monitoring including preoperative assessment and intraoperative and postoperative monitoring
- Screening tool in a sports physical exam to rule out cardiomyopathy[12]
Contraindications
There are no absolute contraindications for EKG. The relative contraindications to its use include:
- Patient refusal
- Allergy to the adhesive used to affix the leads
Equipment
The American College of Cardiology (ACC), in conjunction with American Heart Association (AHA) and the Heart Rhythm Society (HRS), has formulated guidelines and also set technical standards for ECG equipment [13]. With advancements, most of the EKG machines are digital and can autogenerate preliminary findings based on the morphology criteria.
The conventional ECG machine consists of 12 leads, which divide into two groups, i.e., limb leads and precordial leads. Limb leads are further categorized as standard bipolar limb leads I, II and III, and augmented unipolar leads aVL, aVF, and aVR. The precordial leads include V1 to V6. The limb leads view the heart in a vertical plane, and the precordial leads record the electrical activity of the heart in the horizontal plane. The ECG represents a graphic recording of the electrical cardiac activity tracing on the electrocardiograph paper. The fundamental principles behind the recording of an ECG is an electromagnetic force, current or vector that has both magnitude and direction. When a current of depolarization travels towards the electrode, it gets recorded as a positive deflection, and when it moves away from the electrode, it appears as a negative deflection.
- A current of repolarization traveling away from the positive electrode is seen as a positive deflection and towards a positive electrode as a negative deflection
- When the current is perpendicular to the electrode, it touches the baseline and produces a biphasic wave.
These concepts are easily applied to the heart while recording the ECG. There are several types of ECG monitoring equipment available, including continuous ECG monitoring, hardwire cardiac monitoring, telemetry, ambulatory electrocardiography, transtelephonic monitoring, and wireless mobile cardiac monitoring systems, etc. Furthermore, a duo of ECG and electronic stethoscope has been designed into a portable, handheld device that can review ECG rhythms and intervals at the bedside for analysis. With the evolution of technology, there are electronic wristwatches that can also provide monitoring of the heart rate and rhythm and have proven to be of value in detecting atrial fibrillation.[14] The accuracy of these devices, however, may be somewhat inferior when compared to a 12-lead ECG; and when prompted for abnormal findings, these require confirmation by standardized clinical testing available in the Cardiology office.
The equipment for performing a conventional 12-lead ECG includes:
- Electrodes (sensors)
- Gauze and skin preparation (alcohol rub) solution
- Razors or clippers or a roll of tape (for hair removal)
- Skin adhesive and/or antiperspirant
- ECG paper
- Cardiac monitor or electrocardiography machine
Personnel
The medical personnel that can perform the ECG procedure includes a doctor, nurse, or a qualified technician. Usually, it is performed by the technicians either in the clinics or hospitals and then interpreted by physicians. Often, these findings are confirmed by a cardiologist in a hospital-based setting.
Preparation
ECG merely requires special preparation. Before the procedure, a brief history regarding drugs and allergy to adhesive gel is necessary. The temperature of the room must be kept optimal to avoid shivering. The patient should be in a gown, and electrode sites identified. For good contact between body surface and electrodes, it is advised to shave the chest hair and then apply the electrocardiographic adhesive gel for electrodes. Any metallic object like jewelry or watch requires removal, if possible. Limb and precordial leads should be accurately placed to avoid vector misinterpretation. The patient must lie down and relax before recording the standard 10-second strip.
Technique
ECG machines are designed to record changes in the electrical activity by drawing a trace on a moving electrocardiograph paper. The electrocardiograph moves at a speed of 25mm/sec. Time is plotted on the x-axis and voltage on the y-axis. In the x-axis, 1 second is divided into five large squares, each of which represents 0.2 sec. Each large square is further divided into five small squares of 0.04 sec each. The EKG machine is calibrated in such a way that an increase of voltage by one mVolt should move the stylus by 1 cm. The conventional 12-lead EKG consisting of six limbs and six precordial leads is organized into ten wires. The limb leads include I, II, III, aVL, aVR, and aVF and named as RA, LA, RL, and LL. The limb leads are color-coded to avoid misplacement (red- right arm, yellow- left arm, green- left leg, and black- right leg). The precordial leads V1 to V6 are attached to the surface of the chest.[15] For the correct location, the "Angle of Louis" method is an option, and the exact placement is as follows:
- V1 is placed to the right of the sternal border, and V2 is situated at the left of the sternal edge.
- V4 is placed at the level of the fifth intercostal space in the mid-clavicular line. V4 should be placed before V3. V3 is placed between V2 and V4.
- V5 is placed directly between V4 and V6.
- V6 is placed at the level of the fifth intercostal space in the mid-axillary line.
- V4 through V6 should line up horizontally along with the fifth intercostal space.
Complications
ECG is a safe, non-invasive, painless test with no major risks or complications. An allergic reaction or skin sensitivity to the adhesive gel can occur and usually resolves as soon as the electrode patches are removed, and in most cases, do not require any treatment. Artifacts and distortions pose serious diagnostic difficulties and may result in an inaccurate interpretation of the ECGs that may potentially result in an adverse therapeutic intervention.[16][17]
There can be a potential for misdiagnosis due to the inadvertent misplacement of ECG leads.[18][19]
Clinical Significance
The goal of the ECG interpretation is the ability to determine whether the ECG waves and intervals are normal or pathological. Electrical signal interpretation gives a good approximation of heart pathology. A standard 12 lead ECG is shown in [Figure 1]. The best way to interpret an ECG is to read it systematically:
- RATE: For calculation of rate, the number of either small or large squares between an R-R interval should be first calculated. The rate can be calculated by either dividing 300 by the number of big squares or 1500 by the number of small squares between two R-waves. For an irregular rhythm, count the number of beats in a 10-second strip and multiply it by 6.[20] Normal HR is 60 to 99 beats per minute. If it is less than 60, it's called bradycardia and if greater than 100/min, it's called tachycardia
- RHYTHM: The leads I, II, aVF, and V1 require inspection for an accurate interpretation of rhythm. It involves looking for five points: the presence or absence of regular P waves, duration of QRS complexes (narrow or wide), the correlation between P waves and QRS complexes, whether the rhythm is regular or irregular, and also importantly, the morphology of P-waves. A regular rhythm ECG has regular P waves, each preceding a QRS complex in a regular rhythm. Also, normal sinus rhythm demonstrates a positive P-waves in leads I, II, and aVF, suggesting a downward propagation of atrial activation from the SA node. These features also help in identifying if the arrhythmia is originating in the atria or ventricles.[21] Many disorders are related to rhythm abnormalities. For example, in atrial fibrillation, no real P waves can be seen due to the very fast atrial activity, and only a few impulses get delivered to ventricles making the rhythm irregularly irregular. The presence of 'irregularly irregular' narrow QRS complexes with no discrete P waves is the hallmark feature in the identification of atrial fibrillation.
- CARDIAC AXIS: It refers to the general direction of the heart's depolarization wavefront in the frontal plane. The cardiac axis is related to the area of significant muscle bulk within the healthy conducting system. A typical cardiac axis is between -30 to +90 degrees. A quick way to estimate the axis is by looking at leads I and aVF. It can be defined as a normal axis when the QRS complex is positive in both leads I and aVF. A left axis deviation (between 0 and -90 degrees) is defined by the presence of positive QRS in the lead I and negative in lead aVF and right axis deviation(+90 and 180 degrees) by the presence of QRS negative in the lead I and positive in lead aVF. If both QRS complexes are negative in leads I and aVF, it is termed as extreme right axis deviation or indeterminate axis (-90 to 180 degrees).[22] Other methods used for the determination of the cardiac axis include three lead analysis, isoelectric lead analysis, etc. There are several disorders in which the cardiac axis deviates. Examples include conditions like old inferior MI, left ventricular hypertrophy, left bundle branch block where left axis deviation occurs while noting right axis deviation in conditions including right ventricular hypertrophy, pulmonary hypertension, hyperkalemia, and wolf-Parkinson-White syndrome, etc. The specific criteria on ECG for atrial and ventricular hypertrophy are devised from examining various leads and wave morphologies: for atrial abnormality (enlargement/ hypertrophy), leads II and V1 are usually assessed. Right atrial hypertrophy shows an increase in the amplitude in the first half of the P waves by 2.5 mm in inferior leads and a possible right axis deviation.[23] It is often termed as P pulmonale because of its frequent association with chronic obstructive lung disease. Left atrial hypertrophy shows an increase in the amplitude of the terminal component and duration of the P wave, and it must descend at least 1 mm below the isoelectric line in lead V1 and must be at least 0.04 seconds (40 ms) in width. As the left atrium is electrically dominant, it shows no axis deviation.[24]For the diagnosis of ventricular hypertrophy, it requires looking at several leads on the ECG. The right ventricular hypertrophy characteristically shows by right axis deviation along with the presence of a more significant R wave than S wave in lead V1, whereas in lead V6, a more significant S wave than R wave.[25] Left ventricular hypertrophy is characterized by voltage criteria either by calculating the voltage of R wave in V5 or V6 plus the S wave in V1 or V2 exceeding 35mm or by the voltage of R wave exceeding 13 mm in lead aVL. Infrequently, there is also the presence of secondary repolarization abnormalities, including asymmetric T wave inversion and downsloping ST-segment depression, commonly also referred to as the strain pattern; the left axis deviation often accompanies this.[26]
- P-WAVE: It represents atrial depolarization on the ECG. As atrial depolarization initiates by SA node located in the right atrium, the right atrium gets depolarized first, followed by left atrial depolarization. So the first half of P-wave represents right atrial depolarization and the second half left atrial depolarization. Its duration is three small squares wide and 2.5 small squares high. It is always positive in the lead I and II, and consistently negative in lead aVR in normal sinus rhythm. It is commonly biphasic in lead V1. An abnormal P-wave may indicate atrial enlargement.[27]
- PR INTERVAL: It represents the time from the beginning of atrial depolarization to the start of ventricular depolarization and includes the delay that occurs at the AV node. The average interval is 3 to 5 small squares (120 to 200ms).[28] Variations in the PR interval can lead to various disorders. Long PR interval may indicate first degree AV block, and short interval may be present in conditions with accelerated AV conduction such as the presence of bypass tract or Wolf-Parkinson-White syndrome and Lown-Ganong-Levine syndrome.
- Heart Block: A conduction block can occur due to any obstruction in the normal pathway of the electrical conduction. Their anatomical location can be categorized as sinus node, atrioventricular node, or bundle branch blocks. Sinus node or sinoatrial exit block occurs due to failed propagation of the impulses beyond SA node resulting in dropped P waves on the ECG. Common causes include sick sinus syndrome, increased vagal tone, inferior wall MI, vagal stimulation, myocarditis, drugs including digoxin, beta-blockers, etc.Atrioventricular or AV block is a conduction block that can occur anywhere between the SA node and Purkinje fibers. There are three variants of AV blocks: first-degree, second-degree, and third-degree. Clinically significant points in diagnosing the AV blocks include careful measurement of the PR interval and examination of the relationship of the P waves to QRS complexes. First-degree heart block is defined as prolongation of the PR interval by more than 200 milliseconds only. A single P wave precedes every QRS complex. It may be a normal finding in some individuals, but it can be an early sign of degenerative disease of the conduction system or a transient manifestation of myocarditis or drug toxicity, hypokalemia, acute rheumatic fever, etc. It usually does not require any treatment.[29] Second-degree heart block is of two types, i.e., Mobitz type I (also known as Wenkebach block) and Mobitz type II. In type I, the block across the AV node or bundle of His is variable and increases with each ensuing impulse, ultimately resulting in a drop of the impulse (usually every third or fourth impulse). On ECG, it shows as a progressive prolongation of the PR interval, and then suddenly, a P wave is not followed by the QRS complex. This sequence repeats itself in a regular manner. Most patients with Mobitz type I second degree AV block are asymptomatic. Mobitz type I AV block may occur in the setting of acute myocardial ischemia or myocarditis and may also result in clinical deterioration if the resulting ventricular rate is inadequate to maintain cardiac output. Most patients with Mobitz type I second degree AV block are asymptomatic and do not require any specific intervention. Rarely, patients with Mobitz type I block are symptomatic and demonstrate hemodynamically instability and may require treatment with either atropine (emergently) and eventually cardiac pacing. In type II AV block, there is a dropped beat without the progressive lengthening of the PR interval. It follows the all-or-nothing phenomenon. It usually occurs below the AV node at the level of the bundle of His. It clinically signifies a severe underlying heart disease that can progress to third-degree heart block. When diagnosed, it usually requires prompt treatment with a permanent pacemaker.Third-degree heart block is characterized by a complete electrical dissociation between the atria and ventricles, resulting in atria and the ventricles beat at their intrinsic rates. Degenerative disease of the conduction system is the leading cause of third-degree heart block. A complete heart block may present in acute myocardial infarction. Complete heart block may be reversible with prompt revascularization, especially in inferior MI. Lyme disease may be associated with a complete heart block and is potentially reversible with antibiotic therapy. In the case of irreversible or permanent complete heart block, a permanent pacemaker remains the mainstay of the treatment. Bundle branch block results from the conduction block of either left or right bundle branches. It gets diagnosed by examining the width and configuration of the QRS complexes. The right bundle branch block is represented on the ECG by the presence of a widened QRS complex greater than 0.12 seconds along with an RSR pattern in V1 and V2. Also, there may be ST-segment depression and T wave inversions, and reciprocal changes in leads V5, V6, I, and aVL. Conduction system disorders can cause the right bundle branch block, but it may be present as a standard variant in specific individuals. The left bundle branch block is represented on the ECG by a widened QRS complex greater than 0.12 seconds, broad or notched R wave with prolonged upstroke in the leads V5, V6, I and aVL, along with ST-segment depression and T wave inversion, and reciprocal changes in leads V1 and V2. Usually, a left axis deviation is also present. The left bundle branch usually signifies an underlying pathology, such as degenerative disease of the conduction system or ischemic heart disease.
- QRS COMPLEX: It represents ventricular depolarization as current passes down the AV node. A standard QRS complex has a duration of less than three small squares (under 120 ms, usually 60 to 100 ms). A prolonged QRS may indicate hyperkalemia or bundle branch block. A premature ventricular contraction or a ventricular rhythm can be associated with a wide QRS.
- SEPTAL Q-WAVE: Q-wave often appears as a tiny negative deflection in leads I, aVL, V5, and V6. It represents the depolarization of the interventricular septum. Its amplitude is not bigger than 0.1mV; that is why septal depolarization is not always visible on the EKG. Pathological Q-waves on EKG can signify an old infarct. A Q-wave duration of greater than 40 milliseconds (one small box), depth greater than 1 mm, or a size greater than 25% of the QRS complex amplitude is considered to be pathologic.[30]
- R-WAVE: It is the tallest wave of the QRS complex, and it represents the electrical stimulus as it passes down the ventricles during depolarization. The R-wave progressively increases in amplitude moving right to the left in the precordial leads and is called R-wave progression. Lead V1 has the smallest R-wave, and lead V5 has the largest. A reduced R-wave progression has several causes, including prior anteroseptal MI, left ventricular hypertrophy or inaccurate lead placement, etc.[31]
- S-WAVE: It represents the final depolarization of the Purkinje fibers. It is any downward deflection after R-wave. It may not be present in all ECG leads. S-wave is most significant in V1 and progressively becomes smaller to no S-wave in the lead V6.
- T-WAVE: It represents ventricular repolarization. Its morphology is highly susceptible to cardiac and noncardiac influences like ( hormonal, neurological). In leads with tall R-waves, it is usually positive (upward deflection). The suggested criteria for the typical T wave include the size of one-eighth or less than two-thirds of the size of R wave and a height less than 10 mm.Abnormalities in the T-wave morphology can include inverted, flat, biphasic, or tall tented T-waves. T waves can be helpful in a variety of pathologies, tall T waves in anterior chest lead III, aVR, and V1 with a negative QRS complex may suggest acute myocardial ischemia.[32] Other causes of T wave abnormalities are caused by physiological factors (e.g. postprandial state), endocrine or electrolyte imbalance, myocarditis, pericarditis, cardiomyopathy, postcardiac surgery state, pulmonary embolism, fever, infection, anemia, acid-base disorders, drugs, endogenous catecholamines, metabolic changes, acute abdominal process, intracranial pathology,etc.[33]
- ST SEGMENT: It depicts the end of ventricular depolarization and the beginning of ventricular repolarization. The average duration of ST-segment is less than 2 to 3 small squares (80-120ms). ST-segment is an isoelectric line and lies at the same level as PR-interval. Elevation or depression of the ST-segment by 1mm or more, measured at J point, is considered abnormal. A J point is a region between the QRS complex and the ST segment. ST-elevation is highly specific if present in two or more contiguous leads in the setting of acute myocardial infarction. If the vertical distance on the ECG trace and the baseline at a point 0.04 seconds after the J-point is at least 1 mm in a limb lead or 2 mm in a precordial lead is clinically significant for the diagnosis of acute myocardial infarction. Correct ST segment interpretation is crucial as there is a type of ST-segment elevation present in healthy individuals that occurs due to early repolarization and is termed as J-point elevation. It is distinguished by the fact that the T wave does not merge with the ST segment and remains as an independent wave. Several other disorders are also associated with ST-elevation, i.e., Prinzmetal angina, acute pericarditis, acute myocarditis, hyperkalemia, blunt trauma, pulmonary embolism, subarachnoid hemorrhage, Brugada syndrome, ventricular aneurysm, and left bundle branch block.[34][35][36] ST-elevations are diffuse in acute pericarditis and associated with PR-depression in reference to TP-segments (except for leads V1 and aVR).[37][38][39][40]. In myocardial infarction, the ST elevation tends to be localized (inferior, anterior, posterior, lateral), often, but not always with reciprocal ST depression.[41] Second, the PR segment displacement, which is attributable to subepicardial atrial injury. PR elevation can present in aVR, and PR depression is best seen in II, aVF, V4-V6. PR-depression and slight downsloping appearance of TP-segments are often known as the Spodick's sign of pericarditis and help distinguish acute pericarditis from acute MI.[41] ST depression greater than 1 mm is often a sign of myocardial ischemia or angina. It can appear as a downsloping, upsloping, or horizontal segment on the ECG. A horizontal or downsloping ST depression greater than 0.5 mm at the J-point in two or more contiguous leads indicates myocardial ischemia. An upsloping ST depression in the precordial leads with prominent De Winter T waves is highly indicative of MI caused by occlusion of the left anterior descending artery.[42] ST depression can represent a reciprocal change with a morphology that resembles "upside-down" ST elevation and typically seen in leads electrically opposite to the site of infarction. For example, posterior wall MI manifests as horizontal ST depression in leads V1-3 and is associated with tall R waves and upright T waves. Likewise, inferior wall STEMI produces reciprocal ST depression in leads I and aVL, and there is often a reciprocal ST-depression in leads III and aVF in lateral wall MI.[42] ST depressions are also associated with several non-ischemic causes, including digoxin toxicity, hypokalemia, hypothermia, and tachycardia.[43]
- QT INTERVAL: It represents all start of depolarization to the end of repolarization of ventricles. The normal QT interval duration is somewhat controversial, and various normal durations have been previously suggested. In general, the normal QT interval is less than 400 to 440 milliseconds (ms), or 0.4 to 0.44 seconds. Women usually have a slightly longer QT interval than men. A QT interval has an inverse relation to the heart rate. A prolonged QT interval presents an imminent risk for serious ventricular arrhythmias, including Torsades de Pointes, ventricular tachycardia, and ventricular fibrillation. A common cause of QT prolongation includes medications, electrolyte abnormalities such as hypocalcemia and hypomagnesemia and congenital long QT syndrome.[44]A short QT interval ( less than 360 milliseconds) may be present associated with hypercalcemia, acidosis, hyperkalemia, hyperthermia, or short QT syndrome.[45]
- U WAVE: It is a small wave that follows the T wave. It represents the delayed repolarization of the papillary muscles or Purkinje fibers. It is commonly associated with hypokalemia.
- J WAVE: also known as Osborn wave, is an abnormal EKG finding in hypothermia. It appears as an extra deflection on ECG at the junction of the QRS complex and ST-segment.[46]
- EPSILON WAVE: It is a small positive deflection usually found buried at the end of the QRS complex as a characteristic finding in arrhythmogenic right ventricular dysplasia.[47]
Enhancing Healthcare Team Outcomes
ECG monitoring goals from simple heart rate and essential rhythm monitoring have been expanded significantly to the interpretation of complex arrhythmias, myocardial infarction, and other ECG abnormalities.[42] The rapid detection of myocardial infarction has reduced the door-to-balloon time for reperfusion therapy substantially. Nurses' skills regarding assessment and comprehensive knowledge of the dysrhythmias can prevent stroke in atrial fibrillation and improve patient outcomes from the emergency department presentation through discharge and follow-up.[48] Cardiology board-certified pharmacists can make appropriate medication recommendations for several medications, in particular, antiarrhythmics, based on ECG readings and patient history, working in conjunction with the cardiologist.
ECG outcomes in management are noticeable from observation to the critical care floors. An interaction among physicians, nurses, patient care assistants, pharmacists, and ECG technicians is critical to provide the most effective patient care. Interprofessional collaboration and teamwork in the hospital setting prevents significant medical errors by multiple checkpoints and also ensures timely emergency care in cardiac emergencies. For better outcomes, excellent professional ethics, evaluating patients satisfaction, and proficiency of the staff in evaluating ECGs are mandatory. There should be effective communication with appropriate role clarity, shared policies, and strategies to improve system-related issues.[49][50][51] [Level V]
Nursing, Allied Health, and Interprofessional Team Interventions
Continuous EKG monitoring is one of the current technologies being used in the emergency department, intensive, post-anesthesia, and cardiac care units, and often, nurses are the first care responders in these hospital settings. The first interaction of the EKG view puts great responsibility on the nurses in managing technical aspects of the EKG monitoring and also decision-making on the clinical grounds with information received from the monitor. The current practice involved is that nurses initially interpret the EKG and gather data and timely notify the physician-in-charge, to ensure an appropriate management plan.[52]
Nursing, Allied Health, and Interprofessional Team Monitoring
Among the healthcare providers in a hospital setting, especially in intensive and cardiac care units where round the clock monitoring of critical patients is required, nurses play a very crucial role in cardiac monitoring. It is the responsibility of the nurse to assess the patient's clinical condition, monitor, and make sure that an excellent quality of care is delivered. The nurses' should monitor the continuous EKG monitoring very carefully and have competency in initial interpretation. Their knowledge about correct EKG leads placement, analysis, and providing thrombolytic treatment in acute coronary syndrome patients have significant implications in reducing morbidity and mortality.[53]
(Click Image to Enlarge)
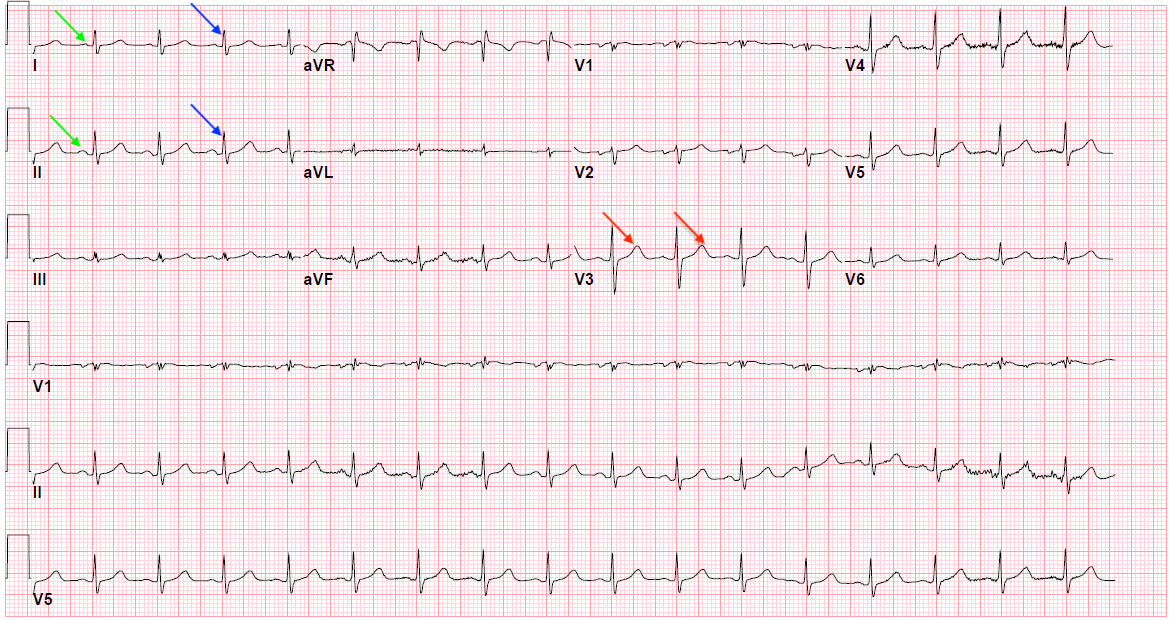
Figure 1: Normal EKG showing P waves (green arrows), QRS complex (blue arrows), and T waves (red arrows)
Contributed by Yasar Sattar, MD
(Click Image to Enlarge)
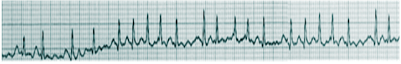
Atrial fibrillation
Image courtesy S Bhimji MD
(Click Image to Enlarge)

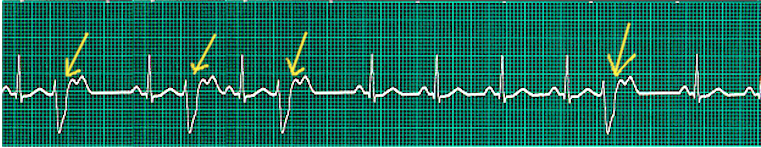
Third degree heart block
Image courtesy S Bhimji MD
(Click Image to Enlarge)

Left atrial enlargement
Image courtesy S Bhimji MD
(Click Image to Enlarge)
Premature ventricular contractions
Image courtesy S Bhimji MD