Connectomics
Connectomics is the production and study of connectomes: comprehensive maps of connections within an organism's nervous system. More generally, it can be thought of as the study of neuronal wiring diagrams with a focus on how structural connectivity, individual synapses, cellular morphology, and cellular ultrastructure contribute to the make up of a network. The nervous system is a network made of billions of connections and these connections are responsible for our thoughts, emotions, actions, memories, function and dysfunction. Therefore, the study of connectomics aims to advance our understanding of mental health and cognition by understanding how cells in the nervous system are connected and communicate. Because these structures are extremely complex, methods within this field use a high-throughput application of functional and structural neural imaging, most commonly magnetic resonance imaging (MRI), electron microscopy, and histological techniques in order to increase the speed, efficiency, and resolution of these nervous system maps. To date, tens of large scale datasets have been collected that spanning the nervous system including the various areas of cortex, cerebellum,[1][2] the retina,[3] the peripheral nervous system[4] and neuromuscular junctions.[5]
Generally speaking, there are two types of connectomes; macroscale and microscale. Macroscale connectomics refers to using functional and structural MRI data to map out large fiber tracts and functional gray matter areas within the brain in terms of blood flow (functional) and water diffusivity (structural). Microscale connectomics is the mapping of small organisms’ complete connectome using microscopy and histology. That is, all connections that exist in their central nervous system.
Methods
Macroscale Connectomics
Macroscale connectomes are commonly collected using diffusion magnetic resonance imaging (dMRI) and functional magnetic resonance imaging (fMRI). dMRI datasets can span the entire brain, imaging white matter between the cortex and subcortex. In contrast, fMRI datasets measure cerebral blood flow in the brain, as a marker of neuronal activation. One of the benefits of MRI is it offers in vivo information about connectivity between different brain areas. Macroscale connectomics has furthered our understanding of various brain networks including visual,[6][7] brainstem,[8][9] and language networks,[10][11] among others.
Microscale Connectomics
On the other hand, microscale connectomes focus on a much smaller area of the nervous system with much higher resolution. These datasets are commonly collected using electron microscopy imaging and offer single synapse resolution of entire local circuits. Some of the milestones in EM connectomics include the entire nervous system of C. elegans,[12] an entire fly brain,[13] and most recently a millimeter cube from both mouse[14] and human cortex.[15]
Tools
One of the main tools used for connectomics research at the macroscale level is MRI.[16] When used together, a resting-state fMRI and a dMRI dataset provide a comprehensive view of how regions of the brain are structurally connected, and how closely they are communicating.[17][18] The main tool for connectomics research at the microscale level is chemical brain preservation followed by 3D electron microscopy,[19] used for neural circuit reconstruction. Correlative microscopy, which combines fluorescence with 3D electron microscopy, results in more interpretable data as is it able to automatically detect specific neuron types and can trace them in their entirety using fluorescent markers.[20]
To see one of the first micro-connectomes at full-resolution, visit the Open Connectome Project, which is hosting several connectome datasets, including the 12TB dataset from Bock et al. (2011).
Model systems
Aside from the human brain, some of the model systems used for connectomics research are the mouse,[21] the fruit fly,[22][23] the nematode C. elegans,[24][25] and the barn owl.[26]
Applications
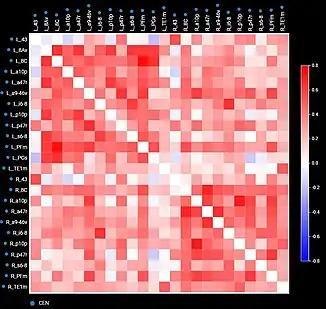
By comparing diseased and healthy connectomes, we can gain insight into certain psychopathologies, such as neuropathic pain, and potential therapies for them. Generally, the field of neuroscience would benefit from standardization and raw data. For example, connectome maps can be used to inform computational models of whole-brain dynamics.[27] Current neural networks mostly rely on probabilistic representations of connectivity patterns.[28] Connectivity matrices (checkerboard diagrams of connectomics) have been used in stroke recovery to evaluate the response to treatment via Transcranial Magnetic Stimulation.[29] Similarly, connectograms (circular diagrams of connectomics) have been used in traumatic brain injury cases to document the extent of damage to neural networks.[30][31]
The human connectome can be viewed as a graph, and the rich tools, definitions and algorithms of the Graph theory can be applied to these graphs. Comparing the connectomes (or braingraphs) of healthy women and men, Szalkai et al.[32][33] have shown that in several deep graph-theoretical parameters, the structural connectome of women is significantly better connected than that of men. For example, women's connectome has more edges, higher minimum bipartition width, larger eigengap, greater minimum vertex cover than that of men. The minimum bipartition width (or, in other words, the minimum balanced cut) is a well-known measure of quality of computer multistage interconnection networks, it describes the possible bottlenecks in network communication: The higher this value is, the better is the network. The larger eigengap shows that the female connectome is better expander graph than the connectome of males. The better expanding property, the higher minimum bipartition width and the greater minimum vertex cover show deep advantages in network connectivity in the case of female braingraph.
Local measures of difference between populations of those graph have been also introduced (e.g. to compare case versus control groups).[34] Those can be found by using either an adjusted t-test,[35] or a sparsity model,[34] with the aim of finding statistically significant connections which are different among those groups.
Human connectomes have an individual variability, which can be measured with the cumulative distribution function, as it was shown in.[36] By analyzing the individual variability of the human connectomes in distinct cerebral areas, it was found that the frontal and the limbic lobes are more conservative, and the edges in the temporal and occipital lobes are more diverse. A “hybrid” conservative/diverse distribution was detected in the paracentral lobule and the fusiform gyrus. Smaller cortical areas were also evaluated: precentral gyri were found to be more conservative, and the postcentral and the superior temporal gyri to be very diverse.
Comparison to genomics
The human genome project initially faced many of the above criticisms, but was nevertheless completed ahead of schedule and has led to many advances in genetics. Some have argued that analogies can be made between genomics and connectomics, and therefore we should be at least slightly more optimistic about the prospects in connectomics.[37] Others have criticized attempts towards a microscale connectome, arguing that we don't have enough knowledge about where to look for insights, or that it cannot be completed within a realistic time frame.[38]
Eyewire game
Eyewire is an online game developed by American scientist Sebastian Seung of Princeton University. It uses social computing to help map the connectome of the brain. It has attracted over 130,000 players from over 100 countries.
Public Datasets
Websites to explore publicly available connectomics datasets:
Macroscale Connectomics (Healthy Young Adult Datasets)
- Human Connectome Project Young Adult
- Amsterdam Open MRI Collection
- Harvard Brain Genomic Superstruct Project
For a more comprehensive list of open macroscale datasets, check out this article
Microscale Connectomics
- Whole C. elegans connectome
- NeuPRINT entire Fly Brain
- MICrONS Explorer (mouse cortical data)
- H01 Browser Release (human cortical data)
See also
- Dynamic Functional Connectivity
- List of Functional Connectivity Software
- Human Connectome Project
- Budapest Reference Connectome
- https://eyewire.org/explore
References
- ↑ Quartarone, Angelo; Cacciola, Alberto; Milardi, Demetrio; Ghilardi, Maria Felice; Calamuneri, Alessandro; Chillemi, Gaetana; Anastasi, Giuseppe; Rothwell, John (2020-02-01). "New insights into cortico-basal-cerebellar connectome: clinical and physiological considerations". Brain. 143 (2): 396–406. doi:10.1093/brain/awz310. ISSN 0006-8950.
- ↑ Nguyen, Tri M.; Thomas, Logan A.; Rhoades, Jeff L.; Ricchi, Ilaria; Yuan, Xintong Cindy; Sheridan, Arlo; Hildebrand, David G. C.; Funke, Jan; Regehr, Wade G.; Lee, Wei-Chung Allen (2021-11-30). "Structured connectivity in the cerebellum enables noise-resilient pattern separation": 2021.11.29.470455. doi:10.1101/2021.11.29.470455v1.
{{cite journal}}: Cite journal requires|journal=(help) - ↑ Helmstaedter, Moritz; Briggman, Kevin L.; Turaga, Srinivas C.; Jain, Viren; Seung, H. Sebastian; Denk, Winfried (2013-08-07). "Connectomic reconstruction of the inner plexiform layer in the mouse retina". Nature. 500 (7461): 168–174. doi:10.1038/nature12346. ISSN 0028-0836.
- ↑ Phelps, Jasper S.; Hildebrand, David Grant Colburn; Graham, Brett J.; Kuan, Aaron T.; Thomas, Logan A.; Nguyen, Tri M.; Buhmann, Julia; Azevedo, Anthony W.; Sustar, Anne; Agrawal, Sweta; Liu, Mingguan (2021-02-04). "Reconstruction of motor control circuits in adult Drosophila using automated transmission electron microscopy". Cell. 184 (3): 759–774.e18. doi:10.1016/j.cell.2020.12.013. ISSN 0092-8674. PMC 8312698.
- ↑ Boonstra, Tjeerd W.; Danna-Dos-Santos, Alessander; Hong-Bo, Xie.; Roerdink, Melvyn; Stins, John F.; Breakspear, Michael (2015). "Muscle networks: Connectivity analysis of EMG activity during postural control". Scientific Reports. 5: 17830. Bibcode:2015NatSR...517830B. doi:10.1038/srep17830. PMC 4669476. PMID 26634293.
- ↑ Kammen, Alexandra; Law, Meng; Tjan, Bosco S.; Toga, Arthur W.; Shi, Yonggang (January 2016). "Automated retinofugal visual pathway reconstruction with multi-shell HARDI and FOD-based analysis". NeuroImage. 125: 767–779. doi:10.1016/j.neuroimage.2015.11.005. ISSN 1053-8119.
- ↑ Yogarajah, M.; Focke, N. K.; Bonelli, S.; Cercignani, M.; Acheson, J.; Parker, G. J. M.; Alexander, D. C.; McEvoy, A. W.; Symms, M. R.; Koepp, M. J.; Duncan, J. S. (2009-05-21). "Defining Meyer's loop-temporal lobe resections, visual field deficits and diffusion tensor tractography". Brain. 132 (6): 1656–1668. doi:10.1093/brain/awp114. ISSN 0006-8950. PMC 2685925.
- ↑ Nieuwenhuys, Rudolf; Voogd, Jan; van Huijzen, Christiaan (2008). "The Human Central Nervous System". doi:10.1007/978-3-540-34686-9.
{{cite journal}}: Cite journal requires|journal=(help) - ↑ Paxinos, George; Xu-Feng, Huang; Sengul, Gulgun; Watson, Charles (2012), "Organization of Brainstem Nuclei", The Human Nervous System, Elsevier, pp. 260–327, retrieved 2021-12-07
- ↑ Glasser, Matthew F.; Rilling, James K. (2008-02-14). "DTI Tractography of the Human Brain's Language Pathways". Cerebral Cortex. 18 (11): 2471–2482. doi:10.1093/cercor/bhn011. ISSN 1460-2199.
- ↑ Catani, Marco; Jones, Derek K.; ffytche, Dominic H. (2004). "Perisylvian language networks of the human brain". Annals of Neurology. 57 (1): 8–16. doi:10.1002/ana.20319. ISSN 0364-5134.
- ↑ "The structure of the nervous system of the nematodeCaenorhabditis elegans". Philosophical Transactions of the Royal Society of London. B, Biological Sciences. 314 (1165): 1–340. 1986-11-12. doi:10.1098/rstb.1986.0056. ISSN 0080-4622.
- ↑ Scheffer, Louis K; Xu, C Shan; Januszewski, Michal; Lu, Zhiyuan; Takemura, Shin-ya; Hayworth, Kenneth J; Huang, Gary B; Shinomiya, Kazunori; Maitlin-Shepard, Jeremy; Berg, Stuart; Clements, Jody (2020-09-03). Marder, Eve; Eisen, Michael B; Pipkin, Jason; Doe, Chris Q (eds.). "A connectome and analysis of the adult Drosophila central brain". eLife. 9: e57443. doi:10.7554/eLife.57443. ISSN 2050-084X. PMID 32880371.
- ↑ MICrONS Consortium; Bae, J. Alexander; Baptiste, Mahaly; Bodor, Agnes L.; Brittain, Derrick; Buchanan, JoAnn; Bumbarger, Daniel J.; Castro, Manuel A.; Celii, Brendan; Cobos, Erick; Collman, Forrest (2021-07-29). "Functional connectomics spanning multiple areas of mouse visual cortex". doi:10.1101/2021.07.28.454025.
{{cite journal}}: Cite journal requires|journal=(help) - ↑ Shapson-Coe, Alexander; Januszewski, Michał; Berger, Daniel R.; Pope, Art; Wu, Yuelong; Blakely, Tim; Schalek, Richard L.; Li, Peter; Wang, Shuohong; Maitin-Shepard, Jeremy; Karlupia, Neha (2021-05-30). "A connectomic study of a petascale fragment of human cerebral cortex": 2021.05.29.446289. doi:10.1101/2021.05.29.446289v1.
{{cite journal}}: Cite journal requires|journal=(help) - ↑ Wedeen, V.J.; Wang, R.P.; Schmahmann, J.D.; Benner, T.; Tseng, W.Y.I.; Dai, G.; Pandya, D.N.; Hagmann, P.; et al. (2008). "Diffusion spectrum magnetic resonance imaging (DSI) tractography of crossing fibers". NeuroImage. 41 (4): 1267–77. doi:10.1016/j.neuroimage.2008.03.036. PMID 18495497. S2CID 2660208.
- ↑ Damoiseaux, Jessica S.; Greicius, Michael D. (2009-10-01). "Greater than the sum of its parts: a review of studies combining structural connectivity and resting-state functional connectivity". Brain Structure and Function. 213 (6): 525–533. doi:10.1007/s00429-009-0208-6. ISSN 1863-2661.
- ↑ Honey, C. J.; Sporns, O.; Cammoun, L.; Gigandet, X.; Thiran, J. P.; Meuli, R.; Hagmann, P. (2009-02-10). "Predicting human resting-state functional connectivity from structural connectivity". Proceedings of the National Academy of Sciences. 106 (6): 2035–2040. doi:10.1073/pnas.0811168106. ISSN 0027-8424. PMID 19188601.
- ↑ Anderson, JR; Jones, BW; Watt, CB; Shaw, MV; Yang, JH; Demill, D; Lauritzen, JS; Lin, Y; et al. (2011). "Exploring the retinal connectome". Molecular Vision. 17: 355–79. PMC 3036568. PMID 21311605.
- ↑ BV, DELMIC. "Neuroscience: Synaptic connectivity in the songbird brain - Application Note | DELMIC". request.delmic.com. Retrieved 2017-02-16.
- ↑ Bock, Davi D.; Lee, Wei-Chung Allen; Kerlin, Aaron M.; Andermann, Mark L.; Hood, Greg; Wetzel, Arthur W.; Yurgenson, Sergey; Soucy, Edward R.; et al. (2011). "Network anatomy and in vivo physiology of visual cortical neurons". Nature. 471 (7337): 177–82. Bibcode:2011Natur.471..177B. doi:10.1038/nature09802. PMC 3095821. PMID 21390124.
- ↑ Chklovskii, Dmitri B; Vitaladevuni, Shiv; Scheffer, Louis K (2010). "Semi-automated reconstruction of neural circuits using electron microscopy". Current Opinion in Neurobiology. 20 (5): 667–75. doi:10.1016/j.conb.2010.08.002. PMID 20833533. S2CID 206950616.
- ↑ Zheng, Z (2018). "A Complete Electron Microscopy Volume of the Brain of Adult Drosophila melanogaster". Cell. 174 (3): 730–743. doi:10.1016/j.cell.2018.06.019. PMC 6063995. PMID 30033368.
- ↑ Chen, B. L.; Hall, D. H.; Chklovskii, D. B. (2006). "Wiring optimization can relate neuronal structure and function". Proceedings of the National Academy of Sciences. 103 (12): 4723–8. Bibcode:2006PNAS..103.4723C. doi:10.1073/pnas.0506806103. PMC 1550972. PMID 16537428.
- ↑ Perez-Escudero, A.; Rivera-Alba, M.; De Polavieja, G. G. (2009). "Structure of deviations from optimality in biological systems". Proceedings of the National Academy of Sciences. 106 (48): 20544–9. Bibcode:2009PNAS..10620544P. doi:10.1073/pnas.0905336106. PMC 2777958. PMID 19918070.
- ↑ Pena, JL; Debello, WM (2010). "Auditory processing, plasticity, and learning in the barn owl". ILAR Journal. 51 (4): 338–52. doi:10.1093/ilar.51.4.338. PMC 3102523. PMID 21131711.
- ↑ http://www.scholarpedia.org/article/Connectome%5B%5D%5B%5D
- ↑ Nordlie, Eilen; Gewaltig, Marc-Oliver; Plesser, Hans Ekkehard (2009). Friston, Karl J. (ed.). "Towards Reproducible Descriptions of Neuronal Network Models". PLOS Computational Biology. 5 (8): e1000456. Bibcode:2009PLSCB...5E0456N. doi:10.1371/journal.pcbi.1000456. PMC 2713426. PMID 19662159.
- ↑ Yeung, Jacky T.; Young, Isabella M.; Doyen, Stephane; Teo, Charles; Sughrue, Michael E. (October 2021). "Changes in the Brain Connectome Following Repetitive Transcranial Magnetic Stimulation for Stroke Rehabilitation". Cureus. 13 (10): e19105. doi:10.7759/cureus.19105. ISSN 2168-8184. PMC 8614179. PMID 34858752.
- ↑ Van Horn, John D.; Irimia, A.; Torgerson, C.M.; Chambers, M.C.; Kikinis, R.; Toga, A.W. (2012). "Mapping connectivity damage in the case of Phineas Gage". PLOS ONE. 7 (5): e37454. Bibcode:2012PLoSO...737454V. doi:10.1371/journal.pone.0037454. PMC 3353935. PMID 22616011.
- ↑ Irimia, Andrei; Chambers, M.C.; Torgerson, C.M.; Filippou, M.; Hovda, D.A.; Alger, J.R.; Gerig, G.; Toga, A.W.; Vespa, P.M.; Kikinis, R.; Van Horn, J.D. (6 February 2012). "Patient-tailored connectomics visualization for the assessment of white matter atrophy in traumatic brain injury". Frontiers in Neurology. 3: 10. doi:10.3389/fneur.2012.00010. PMC 3275792. PMID 22363313.
- ↑ Szalkai, Balazs; Varga, Balint; Grolmusz, Vince (2015). "Graph Theoretical Analysis Reveals: Women's Brains Are Better Connected than Men's". PLOS ONE. 10 (7): e0130045. arXiv:1501.00727. Bibcode:2015PLoSO..1030045S. doi:10.1371/journal.pone.0130045. PMC 4488527. PMID 26132764.
- ↑ Szalkai, Balázs; Varga, Bálint; Grolmusz, Vince (2017). "Brain size bias compensated graph-theoretical parameters are also better in women's structural connectomes". Brain Imaging and Behavior. 12 (3): 663–673. doi:10.1007/s11682-017-9720-0. ISSN 1931-7565. PMID 28447246. S2CID 4028467.
- 1 2 Crimi, Alessandro; Giancardo, Luca; Sambataro, Fabio; Diego, Sona (2019). "MultiLink analysis: brain network comparison via sparse connectivity analysis". Scientific Reports. 9 (1): 1–13. Bibcode:2019NatSR...9...65C. doi:10.1038/s41598-018-37300-4. PMC 6329758. PMID 30635604.
- ↑ Zalesky, Andrew; Fornito, Alex; Bullmore, Edward (2010). "Network-based statistic: identifying differences in brain networks". NeuroImage. 53 (4): 1197–1207. doi:10.1016/j.neuroimage.2010.06.041. PMID 20600983. S2CID 17760084.
- ↑ Kerepesi, Csaba; Szalkai, Balázs; Varga, Bálint; Grolmusz, Vince (2018). "Comparative connectomics: Mapping the inter-individual variability of connections within the regions of the human brain". Neuroscience Letters. 662 (1): 17–21. arXiv:1507.00327. doi:10.1016/j.neulet.2017.10.003. PMID 28988973. S2CID 378080.
- ↑ Lichtman, J; Sanes, J (2008). "Ome sweet ome: what can the genome tell us about the connectome?". Current Opinion in Neurobiology. 18 (3): 346–53. doi:10.1016/j.conb.2008.08.010. PMC 2735215. PMID 18801435.
- ↑ Vance, Ashlee (27 December 2010). "Seeking the Connectome, a Mental Map, Slice by Slice". The New York Times.
Further reading
- Hagmann, Patric; Cammoun, Leila; Gigandet, Xavier; Meuli, Reto; Honey, Christopher J.; Wedeen, Van J.; Sporns, Olaf (2008). Friston, Karl J. (ed.). "Mapping the Structural Core of Human Cerebral Cortex". PLOS Biology. 6 (7): e159. doi:10.1371/journal.pbio.0060159. PMC 2443193. PMID 18597554. Lay summary.
{{cite journal}}: Cite uses deprecated parameter|lay-url=(help)
External links
- The NIH Blueprint for Neuroscience Research
- TED talk by Sebastian Seung: "I am my connectome".
- braingraph.org: a database of hundreds of braingraphs, computed from the data of the Human Connectome Project
Omics | |
|---|---|
| Genomics |
|
| Bioinformatics |
|
| Structural biology |
|
| Research tools |
|
| Organizations |
|
| |