List of European countries by life expectancy
This is a list of European countries by life expectancy.
Life expectancy by country (World Bank Group, 2020)
.svg.png.webp)
List of countries by life expectancy at birth for 2020 according to the World Bank Group.[1][2][3] The data is filtered according to the list of countries in Europe. In the World Bank Group list and, accordingly, in this list, there are no mini-states with a population of several tens of thousands of people (Andorra, Monaco, San Marino, Vatican City). The values in the World Bank Group tables are rounded. All calculations are based on raw data, so due to the nuances of rounding, in some places, illusory inconsistencies of indicators arose, with a size of 0.01 year.
| Countries | all | male | female | gender gap |
Δ 2019 all |
Δ 2019 male |
Δ 2019 female |
Δ 2019 gen. gap |
|---|---|---|---|---|---|---|---|---|
| 83.21 | 81.60 | 84.90 | 3.30 | 0.25 | 0.30 | 0.20 | −0.10 | |
| 83.10 | 81.10 | 85.20 | 4.10 | −0.80 | −1.00 | −0.60 | 0.40 | |
| 83.09 | 80.80 | 85.50 | 4.70 | 0.30 | 0.30 | 0.30 | 0.00 | |
| 83.07 | 81.70 | 84.50 | 2.80 | −0.10 | 0.00 | −0.20 | −0.20 | |
| 82.65 | 80.80 | 84.60 | 3.80 | −0.20 | −0.40 | 0.00 | 0.40 | |
| 82.41 | 80.70 | 84.20 | 3.50 | −0.70 | −0.80 | −0.60 | 0.20 | |
| 82.34 | 80.10 | 84.70 | 4.60 | −1.15 | −1.30 | −1.00 | 0.30 | |
| 82.33 | 79.70 | 85.10 | 5.40 | −1.50 | −1.40 | −1.60 | −0.20 | |
| 82.20 | 80.40 | 84.10 | 3.70 | −0.50 | −0.40 | −0.60 | −0.20 | |
| 82.20 | 80.25 | 84.11 | 3.86 | −0.17 | −0.12 | −0.18 | −0.05 | |
| 82.18 | 79.20 | 85.30 | 6.10 | −0.65 | −0.70 | −0.60 | 0.10 | |
| 82.13 | 79.40 | 85.00 | 5.60 | 0.15 | 0.10 | 0.20 | 0.10 | |
| 81.81 | 80.10 | 83.60 | 3.50 | −2.35 | −2.50 | −2.20 | 0.30 | |
| 81.74 | 79.40 | 84.20 | 4.80 | −0.90 | −0.80 | −1.00 | −0.20 | |
| 81.55 | 79.60 | 83.60 | 4.00 | 0.10 | 0.10 | 0.10 | 0.00 | |
| 81.41 | 79.80 | 83.10 | 3.30 | −0.70 | −0.80 | −0.60 | 0.20 | |
| 81.39 | 79.34 | 83.45 | 4.10 | −0.01 | −0.16 | 0.18 | 0.34 | |
| 81.26 | 79.14 | 83.39 | 4.25 | −0.13 | −0.12 | −0.11 | 0.01 | |
| 81.19 | 78.90 | 83.60 | 4.70 | −0.70 | −0.80 | −0.60 | 0.20 | |
| 81.09 | 78.60 | 83.70 | 5.10 | −0.55 | −0.60 | −0.50 | 0.10 | |
| 80.98 | 78.00 | 84.10 | 6.10 | −0.70 | −0.70 | −0.70 | 0.00 | |
| 80.94 | 78.60 | 83.40 | 4.80 | −0.35 | −0.40 | −0.30 | 0.10 | |
| 80.90 | 79.00 | 82.90 | 3.90 | −0.30 | −0.40 | −0.20 | 0.20 | |
| 80.80 | 78.60 | 83.10 | 4.50 | −1.20 | −1.20 | −1.20 | 0.00 | |
| 80.59 | 78.67 | 82.54 | 3.86 | −0.15 | −0.19 | −0.09 | 0.09 | |
| 80.53 | 77.80 | 83.40 | 5.60 | −1.00 | −0.90 | −1.10 | −0.20 | |
| European Union | 80.47 | 77.75 | 83.33 | 5.57 | −0.85 | −0.91 | −0.78 | 0.13 |
| 78.35 | 74.20 | 82.70 | 8.50 | −0.30 | −0.30 | −0.30 | 0.00 | |
| 78.23 | 75.30 | 81.30 | 6.00 | −1.00 | −1.10 | −0.90 | 0.20 | |
| 77.72 | 74.70 | 80.90 | 6.20 | −0.70 | −0.70 | −0.70 | 0.00 | |
| 76.99 | 74.63 | 79.68 | 5.04 | −2.29 | −2.54 | −1.99 | 0.55 | |
| 76.87 | 73.50 | 80.40 | 6.90 | −0.80 | −0.80 | −0.80 | 0.00 | |
| 76.60 | 72.60 | 80.80 | 8.20 | −1.30 | −1.50 | −1.10 | 0.40 | |
| 76.22 | 74.04 | 78.41 | 4.37 | −1.02 | −1.17 | −0.81 | 0.36 | |
| 75.93 | 73.20 | 78.80 | 5.60 | −0.75 | −0.80 | −0.70 | 0.10 | |
| 75.85 | 72.77 | 79.06 | 6.29 | −1.98 | −1.91 | −1.89 | 0.02 | |
| 75.69 | 73.62 | 77.87 | 4.25 | −0.91 | −1.08 | −0.73 | 0.35 | |
| 75.62 | 72.30 | 79.10 | 6.80 | −0.70 | −0.80 | −0.60 | 0.20 | |
| 75.39 | 70.90 | 80.10 | 9.20 | 0.00 | 0.00 | 0.00 | 0.00 | |
| 74.93 | 70.10 | 80.00 | 9.90 | −1.35 | −1.50 | −1.20 | 0.30 | |
| 74.35 | 70.50 | 78.40 | 7.90 | −1.25 | −1.40 | −1.10 | 0.30 | |
| 74.23 | 71.40 | 77.20 | 5.80 | −1.71 | −2.00 | −1.40 | 0.60 | |
| 74.23 | 69.30 | 79.40 | 10.10 | 0.00 | 0.00 | 0.00 | 0.00 | |
| 73.61 | 69.90 | 77.50 | 7.60 | −1.50 | −1.70 | −1.30 | 0.40 | |
| 72.77 | 67.74 | 77.87 | 10.13 | −0.70 | −0.75 | −0.56 | 0.20 | |
| World | 72.27 | 69.82 | 74.88 | 5.06 | −0.71 | −0.80 | −0.59 | 0.21 |
| 72.17 | 67.05 | 77.00 | 9.94 | −3.27 | −3.35 | −2.86 | 0.49 | |
| 71.37 | 67.09 | 75.53 | 8.44 | −1.81 | −1.73 | −1.77 | −0.04 | |
| 71.34 | 66.49 | 76.43 | 9.94 | −1.75 | −1.75 | −1.74 | 0.01 | |
| 71.19 | 66.39 | 76.22 | 9.83 | −0.64 | −0.53 | −0.76 | −0.23 | |
| 70.17 | 65.69 | 74.85 | 9.16 | −0.77 | −0.69 | −0.77 | −0.08 | |
| 66.87 | 62.99 | 71.00 | 8.01 | −6.23 | −7.24 | −4.83 | 2.41 |
Life expectancy by country (World Bank Group, 2019)
For comparison, life expectancy at birth for 2019 according to the World Bank Group.[1][2][3]
| Countries | all | male | female | gender gap |
Δ 2014 |
Δ 2000 |
|---|---|---|---|---|---|---|
| 84.16 | 82.60 | 85.80 | 3.20 | 2.09 | 7.33 | |
| 83.90 | 82.10 | 85.80 | 3.70 | 0.71 | 4.22 | |
| 83.83 | 81.10 | 86.70 | 5.60 | 0.60 | 4.87 | |
| 83.50 | 81.40 | 85.70 | 4.30 | 0.41 | 3.72 | |
| 83.16 | 81.70 | 84.70 | 3.00 | 0.30 | 3.51 | |
| 83.11 | 81.50 | 84.80 | 3.30 | 0.86 | 3.47 | |
| 82.96 | 81.30 | 84.70 | 3.40 | 0.86 | 4.32 | |
| 82.86 | 81.20 | 84.60 | 3.40 | 0.81 | 4.51 | |
| 82.83 | 79.90 | 85.90 | 6.00 | 0.11 | 3.77 | |
| 82.79 | 80.50 | 85.20 | 4.70 | 1.20 | 4.36 | |
| 82.70 | 80.80 | 84.70 | 3.90 | 1.35 | 6.17 | |
| 82.64 | 80.20 | 85.20 | 5.00 | 0.41 | 4.77 | |
| 82.36 | 80.37 | 84.29 | 3.91 | 0.48 | 0.99 | |
| 82.11 | 80.60 | 83.70 | 3.10 | 0.40 | 4.12 | |
| 82.00 | 79.80 | 84.30 | 4.50 | 0.71 | 4.27 | |
| 81.98 | 79.30 | 84.80 | 5.50 | 0.80 | 4.52 | |
| 81.90 | 79.70 | 84.20 | 4.50 | 0.40 | 3.77 | |
| 81.68 | 78.70 | 84.80 | 6.10 | 0.55 | 5.36 | |
| 81.64 | 79.20 | 84.20 | 5.00 | 0.25 | 3.75 | |
| 81.53 | 78.70 | 84.50 | 5.80 | 0.45 | 6.12 | |
| 81.45 | 79.50 | 83.50 | 4.00 | 0.75 | 4.86 | |
| 81.40 | 79.51 | 83.27 | 3.76 | 0.63 | 4.83 | |
| 81.39 | 79.27 | 83.50 | 4.23 | -0.49 | 2.23 | |
| European Union | 81.31 | 78.67 | 84.11 | 5.44 | 0.44 | 4.24 |
| 81.29 | 79.00 | 83.70 | 4.70 | 0.20 | 3.37 | |
| 81.20 | 79.40 | 83.10 | 3.70 | -0.10 | 3.46 | |
| 80.74 | 78.86 | 82.63 | 3.77 | 0.70 | 6.01 | |
| 79.28 | 77.17 | 81.67 | 4.50 | 0.88 | 3.88 | |
| 79.23 | 76.40 | 82.20 | 5.80 | 0.40 | 4.26 | |
| 78.65 | 74.50 | 83.00 | 8.50 | 1.61 | 8.23 | |
| 78.42 | 75.40 | 81.60 | 6.20 | 0.95 | 5.62 | |
| 77.90 | 74.10 | 81.90 | 7.80 | 0.30 | 4.16 | |
| 77.83 | 74.68 | 80.95 | 6.27 | 1.27 | 5.97 | |
| 77.67 | 74.30 | 81.20 | 6.90 | 0.85 | 4.61 | |
| 77.24 | 75.21 | 79.22 | 4.01 | 1.58 | 2.75 | |
| 76.68 | 74.00 | 79.50 | 5.50 | 0.24 | 2.86 | |
| 76.60 | 74.70 | 78.60 | 3.90 | 1.15 | 3.66 | |
| 76.32 | 73.10 | 79.70 | 6.60 | 0.56 | 5.07 | |
| 76.28 | 71.60 | 81.20 | 9.60 | 1.77 | 4.26 | |
| 75.94 | 73.40 | 78.60 | 5.20 | 0.60 | 4.35 | |
| 75.61 | 71.90 | 79.50 | 7.60 | 0.70 | 4.44 | |
| 75.44 | 70.40 | 79.86 | 9.45 | 1.38 | 4.81 | |
| 75.39 | 70.90 | 80.10 | 9.20 | 1.26 | 5.07 | |
| 75.11 | 71.60 | 78.80 | 7.20 | 0.65 | 3.45 | |
| 74.23 | 69.30 | 79.40 | 10.10 | 1.26 | 5.31 | |
| 73.47 | 68.49 | 78.43 | 9.94 | 0.37 | 3.89 | |
| 73.18 | 68.82 | 77.30 | 8.48 | 1.74 | 7.73 | |
| 73.10 | 70.23 | 75.83 | 5.60 | 1.99 | 8.21 | |
| 73.08 | 68.24 | 78.17 | 9.93 | 2.34 | 7.60 | |
| World | 72.98 | 70.62 | 75.47 | 4.85 | 1.10 | 5.28 |
| 71.83 | 66.92 | 76.98 | 10.06 | 0.64 | 4.15 | |
| 70.94 | 66.38 | 75.62 | 9.24 | 1.90 | 4.52 |
Life expectancy by country (WHO, 2019)
List of countries by life expectancy for 2019 according to the World Health Organization.[4][5] The data is filtered according to the list of countries in Europe. In the WHO list and, accordingly, in this list, there are no mini-states with a population of several tens of thousands of people (Andorra, Liechtenstein, Monaco, San Marino, Vatican City).
| Countries | Life expectancy at birth | HALE at birth | Life expectancy at age 60 | HALE at age 60 | |||||||||||||||||
|---|---|---|---|---|---|---|---|---|---|---|---|---|---|---|---|---|---|---|---|---|---|
| All | M | F | FΔM | Δ 2000 |
All | M | F | FΔM | Δ 2000 |
All | M | F | FΔM | Δ 2000 |
All | M | F | FΔM | Δ 2000 | ||
| 83.4 | 81.8 | 85.1 | 3.3 | 3.7 | 72.5 | 72.2 | 72.8 | 0.6 | 3.2 | 25.4 | 24.1 | 26.6 | 2.5 | 2.4 | 19.5 | 18.8 | 20.2 | 1.4 | 1.8 | ||
| 83.2 | 80.7 | 85.7 | 5.0 | 4.1 | 72.1 | 71.3 | 72.9 | 1.6 | 3.0 | 25.4 | 23.3 | 27.3 | 4.0 | 2.7 | 19.2 | 18.0 | 20.3 | 2.3 | 1.9 | ||
| 83.1 | 81.1 | 85.1 | 4.0 | 4.4 | 72.4 | 71.8 | 73.0 | 1.2 | 3.3 | 24.9 | 23.3 | 26.4 | 3.1 | 3.0 | 19.0 | 18.1 | 19.9 | 1.8 | 2.2 | ||
| 83.0 | 80.9 | 84.9 | 4.0 | 3.6 | 71.9 | 71.2 | 72.6 | 1.4 | 2.9 | 25.0 | 23.4 | 26.5 | 3.1 | 2.5 | 18.9 | 17.9 | 19.8 | 1.9 | 1.8 | ||
| 82.6 | 81.1 | 84.1 | 3.0 | 4.1 | 71.4 | 71.0 | 71.6 | 0.6 | 3.0 | 24.7 | 23.5 | 25.8 | 2.3 | 2.7 | 18.5 | 17.8 | 19.1 | 1.3 | 1.8 | ||
| 82.5 | 79.8 | 85.1 | 5.3 | 3.6 | 72.1 | 71.1 | 73.1 | 2.0 | 2.8 | 25.3 | 23.3 | 27.2 | 3.9 | 2.3 | 19.7 | 18.5 | 20.8 | 2.3 | 1.7 | ||
| 82.4 | 80.8 | 84.0 | 3.2 | 2.8 | 71.9 | 71.7 | 72.1 | 0.4 | 2.0 | 24.5 | 23.3 | 25.6 | 2.3 | 2.1 | 18.9 | 18.3 | 19.4 | 1.1 | 1.5 | ||
| 82.4 | 80.6 | 84.2 | 3.6 | 4.2 | 71.6 | 71.1 | 72.0 | 0.9 | 3.3 | 24.4 | 22.9 | 25.8 | 2.9 | 2.6 | 18.5 | 17.7 | 19.3 | 1.6 | 1.8 | ||
| 82.3 | 80.8 | 83.9 | 3.1 | 2.6 | 72.0 | 71.7 | 72.3 | 0.6 | 2.2 | 24.6 | 23.7 | 25.5 | 1.8 | 2.0 | 19.0 | 18.6 | 19.4 | 0.8 | 1.6 | ||
| 81.9 | 79.9 | 83.8 | 3.9 | 4.0 | 71.5 | 70.9 | 71.9 | 1.0 | 3.0 | 24.5 | 23.0 | 25.9 | 2.9 | 3.7 | 18.9 | 18.0 | 19.6 | 1.6 | 2.7 | Template:Country data Malta | |
| 81.8 | 80.4 | 83.1 | 2.7 | 3.8 | 71.4 | 71.3 | 71.5 | 0.2 | 2.6 | 24.1 | 23.0 | 25.1 | 2.1 | 2.8 | 18.4 | 17.9 | 18.9 | 1.0 | 1.8 | ||
| 81.8 | 80.2 | 83.5 | 3.3 | 5.4 | 71.1 | 70.7 | 71.4 | 0.7 | 4.0 | 24.2 | 23.0 | 25.3 | 2.3 | 4.0 | 18.6 | 18.0 | 19.2 | 1.2 | 2.9 | ||
| 81.7 | 78.7 | 84.8 | 6.1 | 3.6 | 70.9 | 69.7 | 72.1 | 2.4 | 2.4 | 24.4 | 21.9 | 26.9 | 5.0 | 2.6 | 18.5 | 17.0 | 19.9 | 2.9 | 1.7 | ||
| 81.6 | 78.6 | 84.4 | 5.8 | 5.0 | 71.0 | 69.6 | 72.2 | 2.6 | 4.2 | 24.3 | 22.1 | 26.3 | 4.2 | 3.1 | 18.6 | 17.3 | 19.8 | 2.5 | 2.3 | ||
| 81.6 | 79.2 | 84.0 | 4.8 | 4.0 | 71.0 | 69.9 | 72.0 | 2.1 | 3.2 | 24.2 | 22.4 | 25.8 | 3.4 | 2.6 | 18.5 | 17.3 | 19.5 | 2.2 | 2.0 | ||
| 81.6 | 79.4 | 83.8 | 4.4 | 3.4 | 70.9 | 69.9 | 71.9 | 2.0 | 2.7 | 24.1 | 22.4 | 25.6 | 3.2 | 2.1 | 18.3 | 17.2 | 19.4 | 2.2 | 1.6 | ||
| 81.4 | 79.3 | 83.5 | 4.2 | 3.7 | 70.6 | 69.8 | 71.3 | 1.5 | 2.8 | 24.0 | 22.3 | 25.6 | 3.3 | 2.4 | 18.2 | 17.2 | 19.1 | 1.9 | 1.6 | ||
| 81.4 | 79.8 | 83.0 | 3.2 | 3.5 | 70.1 | 69.6 | 70.6 | 1.0 | 2.5 | 24.1 | 23.0 | 25.2 | 2.2 | 2.8 | 18.3 | 17.6 | 18.9 | 1.3 | 2.0 | ||
| 81.3 | 79.6 | 83.0 | 3.4 | 4.4 | 71.0 | 70.7 | 71.4 | 0.7 | 3.4 | 23.6 | 22.3 | 24.9 | 2.6 | 3.0 | 18.2 | 17.6 | 18.9 | 1.3 | 2.2 | ||
| 81.3 | 78.6 | 84.1 | 5.5 | 5.2 | 70.7 | 69.0 | 72.5 | 3.5 | 4.2 | 23.8 | 21.8 | 25.6 | 3.8 | 3.3 | 17.8 | 16.4 | 19.2 | 2.8 | 2.5 | ||
| 81.1 | 78.6 | 83.6 | 5.0 | 2.9 | 70.9 | 69.9 | 71.9 | 2.0 | 2.3 | 23.8 | 22.1 | 25.5 | 3.4 | 2.3 | 18.4 | 17.3 | 19.5 | 2.2 | 1.6 | ||
| 79.1 | 76.3 | 81.9 | 5.6 | 4.1 | 68.8 | 67.0 | 70.6 | 3.6 | 2.9 | 22.1 | 19.9 | 24.0 | 4.1 | 2.8 | 16.3 | 14.7 | 17.8 | 3.1 | 1.7 | ||
| 78.9 | 74.7 | 82.6 | 7.9 | 8.0 | 69.2 | 66.4 | 71.7 | 5.3 | 6.6 | 22.5 | 19.3 | 25.0 | 5.7 | 3.9 | 17.3 | 14.8 | 19.1 | 4.3 | 3.0 | ||
| 78.6 | 75.5 | 81.6 | 6.1 | 4.2 | 68.6 | 66.7 | 70.5 | 3.8 | 3.2 | 21.8 | 19.4 | 23.7 | 4.3 | 2.8 | 16.2 | 14.6 | 17.7 | 3.1 | 1.8 | ||
| 78.6 | 76.4 | 80.7 | 4.3 | 4.2 | 68.4 | 67.8 | 69.0 | 1.2 | 3.4 | 22.0 | 20.6 | 23.2 | 2.6 | 0.5 | 16.6 | 15.8 | 17.3 | 1.5 | 0.3 | ||
| 78.3 | 74.5 | 81.9 | 7.4 | 4.6 | 68.7 | 65.9 | 71.3 | 5.4 | 3.7 | 22.1 | 19.5 | 24.3 | 4.8 | 2.9 | 16.8 | 14.9 | 18.5 | 3.6 | 2.1 | ||
| 78.2 | 74.8 | 81.4 | 6.6 | 4.9 | 68.5 | 66.2 | 70.8 | 4.6 | 3.8 | 21.8 | 19.3 | 23.9 | 4.6 | 3.3 | 16.6 | 14.6 | 18.2 | 3.6 | 2.4 | ||
| Europe[6] | 78.2 | 75.1 | 81.3 | 6.2 | 5.7 | 68.3 | 66.6 | 70.0 | 3.4 | 4.6 | 22.5 | 20.5 | 24.3 | 3.8 | 2.9 | 17.1 | 15.8 | 18.3 | 2.5 | 2.1 | |
| 78.0 | 76.3 | 79.9 | 3.6 | 4.5 | 69.1 | 68.0 | 70.3 | 2.3 | 3.9 | 21.0 | 20.2 | 21.9 | 1.7 | 2.0 | 16.6 | 15.9 | 17.3 | 1.4 | 1.6 | ||
| 76.8 | 74.4 | 79.1 | 4.7 | 1.4 | 67.2 | 65.7 | 68.7 | 3.0 | 1.0 | 20.2 | 18.6 | 21.6 | 3.0 | 0.6 | 15.2 | 14.1 | 16.2 | 2.1 | 0.2 | ||
| 76.4 | 73.1 | 79.6 | 6.5 | 5.1 | 67.2 | 65.0 | 69.3 | 4.3 | 4.2 | 20.2 | 17.7 | 22.3 | 4.6 | 2.2 | 15.3 | 13.4 | 16.8 | 3.4 | 1.7 | ||
| 76.0 | 72.5 | 79.2 | 6.7 | 4.1 | 67.1 | 64.9 | 69.1 | 4.2 | 3.6 | 20.4 | 18.2 | 22.1 | 3.9 | 1.6 | 15.7 | 14.2 | 16.9 | 2.7 | 1.2 | ||
| 76.0 | 71.2 | 80.4 | 9.2 | 4.0 | 66.7 | 63.4 | 69.7 | 6.3 | 3.6 | 20.9 | 17.6 | 23.5 | 5.9 | 1.4 | 15.9 | 13.4 | 17.8 | 4.4 | 1.2 | ||
| 75.9 | 73.2 | 78.7 | 5.5 | 2.3 | 67.0 | 65.2 | 68.7 | 3.5 | 1.8 | 19.4 | 17.4 | 21.3 | 3.9 | 0.2 | 14.9 | 13.5 | 16.3 | 2.8 | 0.0 | ||
| 75.9 | 73.5 | 78.3 | 4.8 | 4.5 | 66.9 | 65.4 | 68.4 | 3.0 | 3.5 | 19.6 | 17.9 | 21.1 | 3.2 | 2.5 | 14.9 | 13.7 | 16.0 | 2.3 | 1.7 | ||
| 75.6 | 72.0 | 79.3 | 7.3 | 4.2 | 66.8 | 64.3 | 69.4 | 5.1 | 3.5 | 20.3 | 17.8 | 22.4 | 4.6 | 2.1 | 15.7 | 13.8 | 17.3 | 3.5 | 1.6 | ||
| 75.4 | 70.6 | 79.8 | 9.2 | 5.2 | 66.2 | 62.9 | 69.3 | 6.4 | 4.6 | 20.5 | 17.2 | 23.0 | 5.8 | 2.2 | 15.6 | 13.2 | 17.4 | 4.2 | 1.7 | ||
| 75.1 | 71.6 | 78.6 | 7.0 | 3.5 | 66.3 | 63.9 | 68.7 | 4.8 | 2.8 | 19.8 | 17.4 | 22.0 | 4.6 | 2.2 | 15.2 | 13.4 | 16.9 | 3.5 | 1.5 | ||
| 74.8 | 72.8 | 76.9 | 4.1 | 3.7 | 66.1 | 65.1 | 67.3 | 2.2 | 2.9 | 18.3 | 17.0 | 19.6 | 2.6 | 1.9 | 14.0 | 13.1 | 14.9 | 1.8 | 1.3 | ||
| 74.8 | 69.7 | 79.6 | 9.9 | 6.0 | 66.0 | 62.3 | 69.4 | 7.1 | 5.2 | 19.7 | 16.0 | 22.5 | 6.5 | 2.5 | 15.1 | 12.3 | 17.2 | 4.9 | 2.0 | ||
| 74.0 | 70.0 | 77.6 | 7.6 | 10.9 | 65.0 | 62.4 | 67.4 | 5.0 | 8.9 | 19.5 | 16.8 | 21.4 | 4.6 | 4.2 | 14.8 | 13.0 | 16.2 | 3.2 | 3.0 | ||
| 73.3 | 68.8 | 77.8 | 9.0 | 3.9 | 64.7 | 61.4 | 67.9 | 6.5 | 2.8 | 18.8 | 16.0 | 21.0 | 5.0 | 1.8 | 14.4 | 12.4 | 16.1 | 3.7 | 1.0 | ||
| 73.3 | 69.3 | 77.1 | 7.8 | 6.4 | 64.5 | 61.9 | 67.1 | 5.2 | 5.2 | 19.0 | 16.6 | 20.9 | 4.3 | 3.2 | 14.6 | 12.8 | 16.0 | 3.2 | 2.5 | ||
| World | 73.3 | 70.8 | 75.9 | 5.1 | 6.5 | 63.7 | 62.5 | 64.9 | 2.4 | 5.4 | 21.1 | 19.5 | 22.7 | 3.2 | 2.3 | 15.8 | 14.8 | 16.6 | 1.8 | 1.7 | |
| 73.2 | 68.2 | 78.0 | 9.8 | 7.9 | 64.2 | 60.7 | 67.5 | 6.8 | 6.9 | 19.9 | 16.8 | 22.2 | 5.4 | 3.5 | 15.0 | 12.8 | 16.7 | 3.9 | 2.7 | ||
| 73.0 | 68.0 | 77.8 | 9.8 | 5.5 | 64.3 | 60.6 | 67.8 | 7.2 | 4.6 | 19.5 | 16.4 | 21.7 | 5.3 | 2.7 | 15.0 | 12.7 | 16.7 | 4.0 | 2.2 | ||
| 71.4 | 68.8 | 74.1 | 5.3 | 5.9 | 63.6 | 62.1 | 65.2 | 3.1 | 5.1 | 17.1 | 15.6 | 18.3 | 2.7 | 0.5 | 13.4 | 12.4 | 14.2 | 1.8 | 0.3 | ||
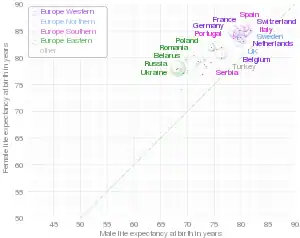
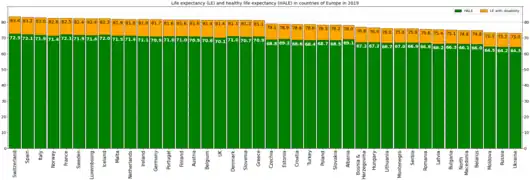 Life expectancy and HALE in countries of Europe in 2019
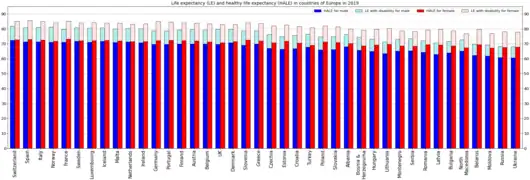 Elaboration by gender
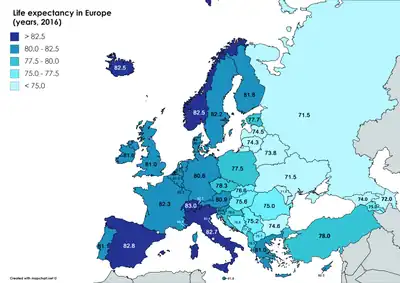
Map (2018)
The map and table below cites life expectancy per country from The World Bank's 2018 statistics.[7] Hotter colours indicate lower life expectancy, colder colours indicate high life expectancy.
Sea
Biscay
Sea
Sea
Sea
Sea
Cadiz
Sea
Atlantic
Ocean
Sea
Sea
Life expectancy by country (2016)
| Rank | Country | Life expectancy[7] | Influenza vaccination rate, people aged 65 and over, 2016 (%)[8] |
|---|---|---|---|
| 1 | Template:Country data Monaco[9] | 89.4 | |
| 2 | Template:Country data San Marino[10] | 83.4 | |
| 3 | 83.0 | ||
| 4 | 82.8 | 56% | |
| 5 | Template:Country data Liechtenstein | 82.7 | 28% |
| 6 | 82.7 | 50% | |
| 7 | 82.5 | 38% | |
| 8 | 82.5 | 47% | |
| 9 | 82.3 | 38% | |
| 10 | 82.3 | 50% | |
| 11 | 82.2 | 49% | |
| 12 | Template:Country data Malta | 81.8 | |
| 13 | 81.8 | 47% | |
| 14 | 81.6 | 55% | |
| 15 | 81.5 | 65% | |
| 16 | 81.1 | 58% | |
| 17 | 81.0 | ||
| 18 | 81.0 | 71% | |
| 19 | 81.0 | ||
| 20 | 80.9 | ||
| 21 | 80.8 | 10% | |
| 22 | 80.7 | 41% | |
| 23 | 80.6 | 35% | |
| 24 | 80.5 | ||
| 25 | 78.3 | ||
| 26 | 78.3 | ||
| 27 | 78.0 | 21% | |
| 28 | 77.7 | 3% | |
| 29 | 77.5 | ||
| 30 | 77.1 | 13% | |
| 31 | 76.9 | ||
| 32 | 76.6 | 10% | |
| 33 | 75.8 | 7% | |
| 34 | 75.7 | 6% | |
| 35 | 75.6 | 20% | |
| 36 | 75.2 | 11% | |
| 37 | 75.0 | 8% | |
| 38 | 74.6 | ||
| 39 | 74.5 | 4% | |
| 40 | 74.3 | 23% | |
| 41 | 73.8 | ||
| 42 | 72.1 | ||
| 43 | 71.6 | ||
| 44 | 71.6 | ||
See also
- List of European regions by life expectancy
- List of countries by life expectancy
- List of European countries by population
- List of German states by life expectancy
- List of federal subjects of Russia by life expectancy
- Oldest people
- Longevity
- Life extension
Plotted maps
- European countries by electricity consumption per person
- European countries by employment in agriculture (% of employed)
- European countries by fossil fuel use (% of total energy)
- European countries by health expense per person
- European countries by military expenditure as a percentage of government expenditure
- European countries by percent of population aged 0-14
- European countries by percentage of urban population
- European countries by percentage of women in national parliaments
- List of European countries by number of Internet users
- International organisations in Europe
- List of European countries by budget revenues
- List of European countries by budget revenues per capita
- List of European countries by GDP (nominal) per capita
- List of European countries by GDP (PPP) per capita
- List of European countries by GNI (nominal) per capita
- List of European countries by GNI (PPP) per capita
- List of countries by GDP (nominal) per capita
- List of countries by GDP (PPP) per capita
- List of countries by GDP (nominal)
- List of countries by GDP (PPP)
References
- 1 2 "Life expectancy at birth, total". The World Bank Group. 22 December 2022. Archived from the original on 1 May 2022. Retrieved 18 February 2023.
- 1 2 "Life expectancy at birth, male". The World Bank Group. 22 December 2022. Archived from the original on 1 May 2022. Retrieved 18 February 2023.
- 1 2 "Life expectancy at birth, female". The World Bank Group. 22 December 2022. Archived from the original on 1 May 2022. Retrieved 18 February 2023.
- ↑ "Life expectancy and Healthy life expectancy, data by country". World Health Organization. 4 December 2022. Archived from the original on 5 March 2013. Retrieved 4 April 2023.
- ↑ "Life expectancy and Healthy life expectancy, data by WHO region". World Health Organization. 7 December 2022. Archived from the original on 27 May 2016. Retrieved 4 April 2023.
- ↑ "WHO: Europe: Countries". World Health Organization. Archived from the original on 11 May 2022. Retrieved 7 May 2022.
- 1 2 "Life expectancy at birth, total (years)". WORLDBANK.org. The World Bank. Archived from the original on 10 October 2017. Retrieved 10 August 2018.
- ↑ "Vaccination against influenza of population aged 65 and over". eurostat. Archived from the original on 13 July 2019. Retrieved 4 April 2023.
- ↑ "Europe :: Monaco — The World Factbook - Central Intelligence Agency". www.cia.gov. Archived from the original on 30 December 2021. Retrieved 29 March 2019.
- ↑ "Europe :: San Marino — The World Factbook - Central Intelligence Agency". www.cia.gov. Archived from the original on 12 January 2021. Retrieved 29 March 2019.
Template:Lists of countries by population statistics