1922 Polish parliamentary election
Parliamentary elections were held in Poland on 5 November 1922, with Senate elections held a week later on 12 November.[1] The elections were governed by the March Constitution of Poland, and saw the Christian Union of National Unity coalition emerge as the largest bloc in the Sejm with 163 of the 444 seats.
| |||||||||||||||||||||||||||||||||||||||||||||||||||||||||||||||||||||||||||||||||||||
All 444 seats in the Sejm | |||||||||||||||||||||||||||||||||||||||||||||||||||||||||||||||||||||||||||||||||||||
|---|---|---|---|---|---|---|---|---|---|---|---|---|---|---|---|---|---|---|---|---|---|---|---|---|---|---|---|---|---|---|---|---|---|---|---|---|---|---|---|---|---|---|---|---|---|---|---|---|---|---|---|---|---|---|---|---|---|---|---|---|---|---|---|---|---|---|---|---|---|---|---|---|---|---|---|---|---|---|---|---|---|---|---|---|---|
| |||||||||||||||||||||||||||||||||||||||||||||||||||||||||||||||||||||||||||||||||||||
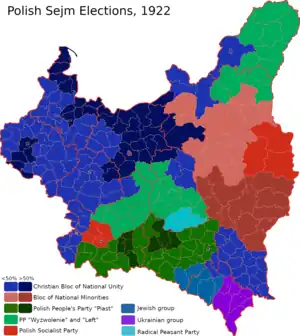 Winning party by electoral districts | |||||||||||||||||||||||||||||||||||||||||||||||||||||||||||||||||||||||||||||||||||||
 |
|---|
The resulting coalitions were unstable, and the situation - difficult from the start, with assassination of Polish president Gabriel Narutowicz in December shortly after the elections - culminated in 1926 with the May Coup.
Results
Sejm
| Party | Votes | % | Seats | +/– | |
|---|---|---|---|---|---|
| Christian Union of National Unity | 2,551,582 | 29.12 | 163 | +23 | |
| Bloc of National Minorities | 1,398,250 | 15.96 | 66 | New | |
| Polish People's Party "Piast" | 1,153,397 | 13.16 | 70 | +24 | |
| Polish People's Party "Wyzwolenie" | 963,385 | 10.99 | 49 | –10 | |
| Polish Socialist Party | 906,537 | 10.35 | 41 | +6 | |
| National Workers' Party | 473,676 | 5.41 | 18 | –14 | |
| Jewish Group | 405,961 | 4.63 | 18 | +7 | |
| Polish Centre | 259,956 | 2.97 | 6 | – | |
| Ukrainian Group | 136,044 | 1.55 | 5 | – | |
| Communist Party of Poland | 121,448 | 1.39 | 2 | – | |
| Radical Peasant Party | 115,515 | 1.32 | 4 | New | |
| Polish People's Party "Left" | 59,104 | 0.67 | 2 | –10 | |
| People's Council | 46,317 | 0.53 | 0 | – | |
| National-State Union | 38,160 | 0.44 | 0 | – | |
| Urban Centre | 29,653 | 0.34 | 0 | – | |
| Invalids and Demobilised Soldiers | 11,871 | 0.14 | 0 | – | |
| Others | 91,842 | 1.05 | 0 | – | |
| Total | 8,762,698 | 100.00 | 444 | +50 | |
| Valid votes | 8,762,698 | 99.33 | |||
| Invalid/blank votes | 58,977 | 0.67 | |||
| Total votes | 8,821,675 | 100.00 | |||
| Registered voters/turnout | 12,989,718 | 67.91 | |||
| Source: Nohlen & Stöver | |||||
Senate
| Party | Votes | % | Seats | |
|---|---|---|---|---|
| Christian Union of National Unity | 2,173,756 | 38.70 | 48 | |
| Bloc of National Minorities | 977,075 | 17.40 | 23 | |
| Polish People's Party "Piast" | 729,622 | 12.99 | 17 | |
| Polish People's Party "Wyzwolenie" | 529,675 | 9.43 | 8 | |
| Polish Socialist Party | 468,147 | 8.34 | 7 | |
| National Workers' Party | 291,779 | 5.20 | 3 | |
| Jewish Group | 179,626 | 3.20 | 4 | |
| Radical Peasant Party | 56,339 | 1.00 | 0 | |
| Państwowe Zjednoczenie na Kresach | 55,953 | 1.00 | 1 | |
| Polish Centre | 55,805 | 0.99 | 0 | |
| Communist Party of Poland | 51,094 | 0.91 | 0 | |
| Polish People's Party "Left" | 25,362 | 0.45 | 0 | |
| Union of People's Councils | 10,096 | 0.18 | 0 | |
| Urban Centre | 3,111 | 0.06 | 0 | |
| National-State Union | 2,338 | 0.04 | 0 | |
| Others | 6,713 | 0.12 | 0 | |
| Total | 5,616,491 | 100.00 | 111 | |
| Valid votes | 5,616,491 | 99.35 | ||
| Invalid/blank votes | 36,838 | 0.65 | ||
| Total votes | 5,653,329 | 100.00 | ||
| Registered voters/turnout | 9,085,690 | 62.22 | ||
| Source: Nohlen & Stöver | ||||
Ethnoreligious voting analysis
According to Kopstein and Wittenberg, 39% of the majority Catholic population voted for right-wing parties, 29% for non-revolutionary left-wing parties and 25% for centrist parties. The other ethnoreligious groups, including Uniates, Jews and Orthodox Christians voted largely for parties representing minority groups.[2]
Some regional differences were observed; in western Poland, 9% of the Catholic vote went to minority interest parties, which has been attributed in part to German Catholic voting, but in the east, only 1% did. Ethnic Polish support for the right wing was stronger in the east of the country, where 40% voted for right-wing parties, as opposed to the south where 16% did. No detectable regional variation existed among Jews.[3] The lack of support for the center and right among the major minorities (Jews, Ukrainians and Belarusians) was attributed to ethnic polarization that was exacerbated by discrimination and chauvinism from Polish officials.[4] Despite the success of minority parties, parties describing themselves as "Polish" refused to form a government with minority parties, and there was not one non-ethnic Polish cabinet member in the interwar period, though interethnic cooperation could still be seen in Ukrainian and Belarusian support for the Sikorski government.[3]
| Estimates of voting patterns by ethnoreligious groups | ||||||
|---|---|---|---|---|---|---|
| Religion | Communists | Nonrevolutionary left | Minority interest parties | Center | Right-wing | Overall share (1921 census) |
| Catholic | 2% | 29% | 4% | 25% | 39% | 64% |
| Uniate | 3% | 2% | 77% | 1% | 5% | 12% |
| Orthodox Christian | 8% | 37% | 66% | 1% | 1% | 10% |
| Jewish | 4% | 18% | 65% | 2% | 4% | 11% |
| Overall share (1921 census) | 2% | 16% | 24% | 25% | 34% | |
References
- Dieter Nohlen & Philip Stöver (2010) Elections in Europe: A data handbook, p1491 ISBN 978-3-8329-5609-7
- Jeffrey S. Kopstein & Jason Wittenberg. "Who voted communist? Reconsidering the social bases of radicalism in interwar Poland." Slavic Review 62.1 (2003): pp87-109
- Kopstein & Wittenberg, p99
- Kopstein & Wittenberg, p98
Further reading
- A. J. Groth, Polish Elections 1919-1928, Slavic Review, Vol. 24, No. 4 (Dec., 1965), pp. 653–665 JSTOR

.jpg.webp)