1934 Tasmanian state election
The 1934 Tasmanian state election was held on 9 June 1934 in the Australian state of Tasmania to elect 30 members of the Tasmanian House of Assembly. The election used the Hare-Clark proportional representation system[1] — six members were elected from each of five electorates.
| |||||||||||||||||||||||||||||||
All 30 seats to the House of Assembly | |||||||||||||||||||||||||||||||
|---|---|---|---|---|---|---|---|---|---|---|---|---|---|---|---|---|---|---|---|---|---|---|---|---|---|---|---|---|---|---|---|
| |||||||||||||||||||||||||||||||
| |||||||||||||||||||||||||||||||
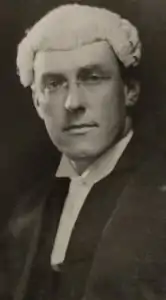
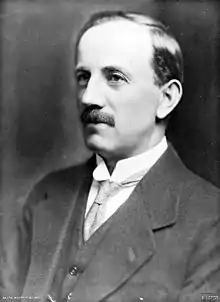
The Nationalist Party won a huge victory in the 1931 election, but Premier of Tasmania John McPhee had resigned due to health problems, and the Nationalists were led into the 1934 election by former Premier Walter Lee. The Labor Party were led by Albert Ogilvie, who had managed to heal some of the rifts in the Labor Party that had contributed to their election loss in 1931.[2]
Labor regained much of their ground in the 1934 election, winning 14 seats compared to the Nationalists' 13 (although the Nationalists had received more votes), not enough to govern in a majority. Three seats were won by Independent candidates, and it was only through the support of one of these (George Carruthers, an ex-Labor man and proponent of the Douglasite Social Credit concept), that Labor was able to form government, with Ogilvie as Premier.[2]
Labor began an uninterrupted 35 year rule over Tasmania until 1969, which marks the longest stretch of continuous Labor rule in any state or territory in its history.
Results
|
1934 Tasmanian state election | ||||||
|---|---|---|---|---|---|---|
| Enrolled voters | 127,681 | |||||
| Votes cast | 120,622 | Turnout | 94.47% | –0.52% | ||
| Informal votes | 3,885 | Informal | 3.20% | –0.25% | ||
| Summary of votes by party | ||||||
| Party | Primary votes | % | Swing | Seats | Change | |
| Nationalist | 54,549 | 46.72% | –9.68% | 13 | – 6 | |
| Labor | 53,454 | 45.78% | +10.85% | 14 | + 4 | |
| Independent | 8,764 | 7.51% | –1.17% | 3 | + 2 | |
| Total | 116,767 | 30 | ||||
Distribution of votes
Primary vote by division
| Bass | Darwin | Denison | Franklin | Wilmot | |
|---|---|---|---|---|---|
| Labor Party | 50.8% | 40.8% | 48.7% | 51.9% | 35.8% |
| Nationalist | 49.2% | 52.8% | 37.8% | 37.8% | 57.0% |
| Other | – | 6.3% | 13.5% | 10.3% | 7.3% |
See also
References
- House of Assembly Elections, Parliament of Tasmania.
- Michael Roe, Ogilvie, Albert George (1890 - 1939), Australian Dictionary of Biography, Volume 11, Melbourne University Press, 1988, pp 68-70.
External links
- Assembly Election Results, 1934, Parliament of Tasmania.
- Report on General Election, 1934, Tasmanian Electoral Commission.

