1936 French legislative election
Legislative elections were held in France on 26 April and 3 May 1936, the last elections before World War II. The number of candidates set a record, with 4,807 running for election to the Chamber of Deputies. In the Seine Department alone, there were 1,402 candidates.[1]
| |||
All 608 seats in the Chamber of Deputies 306 seats were needed for a majority | |||
|---|---|---|---|
| Registered | 11,68,491 | ||
| Turnout | 84.45% | ||
|
| |||
| |||
 |
|---|
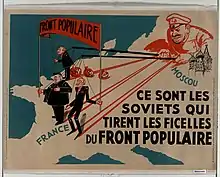
The Popular Front, composed of the French Section of the Workers' International (SFIO), the Radical-Socialists, the French Section of the Communist International (SFIC), and miscellaneous leftists, won power from the broad Republican coalitions that had governed since the 6 February 1934 crisis. Léon Blum became president of the council.
Results
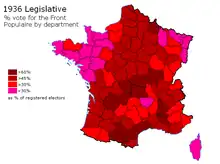
The SFIC, predecessor of the Communist Party, doubled its score from 11 SFIC and 9 Union Ouvrière deputies in 1932 to 72 in 1936. The party made gains in industrialized suburbs and working-class areas of major cities. They also progressed in rural central and southwestern France (e.g., Dordogne, Lot-et-Garonne) The Radicals lost votes to the SFIO and SFIC, but also to the right. The SFIO declined slightly. In working-class suburbs, the party declined, but it gained votes in Brittany, to the dismay of the right. Only 174 seats were elected in the first round, 424 were decided in a run-off. The right fared better in the second round.
| Party or alliance | Votes | % | Seats | |||
|---|---|---|---|---|---|---|
| Popular Front | French Section of the Workers' International | 1,955,306 | 19.86 | 149 | ||
| French Communist Party | 1,502,404 | 15.26 | 72 | |||
| Radical Socialist Party | 1,422,611 | 14.45 | 56 | |||
| Republican-Socialist Party | 748,600 | 7.60 | 109 | |||
| Total | 5,628,921 | 57.16 | 386 | |||
| National Front | Republican Left | 2,536,294 | 25.76 | 222 | ||
| Republican Union | 1,666,004 | 16.92 | ||||
| Total | 4,202,298 | 42.67 | 222 | |||
| Others | 16,047 | 0.16 | 0 | |||
| Total | 9,847,266 | 100.00 | 608 | |||
| Valid votes | 9,847,266 | 99.09 | ||||
| Invalid/blank votes | 90,692 | 0.91 | ||||
| Total votes | 9,937,958 | 100.00 | ||||
| Registered voters/turnout | 11,768,491 | 84.45 | ||||
| Source: Mackie & Rose,[2] Nohlen & Stöver,[3] France Politique | ||||||
References
- "French elections a task for voters", The New York Times. 20 April 1936. Page 7.
- Thomas T. Mackie & Richard Rose (1982) The International Almanac of Electoral History, Macmillan, pp128–130
- Dieter Nohlen & Philip Stöver (2010) Elections in Europe: A data handbook, p692 ISBN 9783832956097
External links
| Presidential | |
|---|---|
| Parliamentary |
|
| Regional | |
| Cantonal then Departemental |
|
| Municipal | |
| Consular |
|
| European | |
| Referendums | |
| |