1955 Ontario general election
The 1955 Ontario general election was held on June 9, 1955, to elect the 98 members of the 25th Legislative Assembly of Ontario (Members of Provincial Parliament, or "MPPs") of the Province of Ontario.[1]
| |||||||||||||||||||||||||||||||||||||||||||||||||||||||||||||||||
98 seats in the 25th Legislative Assembly of Ontario 50 seats were needed for a majority | |||||||||||||||||||||||||||||||||||||||||||||||||||||||||||||||||
|---|---|---|---|---|---|---|---|---|---|---|---|---|---|---|---|---|---|---|---|---|---|---|---|---|---|---|---|---|---|---|---|---|---|---|---|---|---|---|---|---|---|---|---|---|---|---|---|---|---|---|---|---|---|---|---|---|---|---|---|---|---|---|---|---|---|
| |||||||||||||||||||||||||||||||||||||||||||||||||||||||||||||||||
| |||||||||||||||||||||||||||||||||||||||||||||||||||||||||||||||||
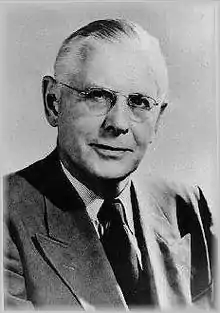


The Ontario Progressive Conservative Party, led by Leslie Frost, won a fifth consecutive term in office, increasing its caucus in the legislature from 79 in the previous election to 83.
The Ontario Liberal Party, again led by Farquhar Oliver, won three additional seats in the enlarged legislature, increasing its caucus from 8 to 11, and continuing in the role of official opposition. Liberal-Labour MPP Albert Wren was re-elected and continued to sit with the Liberal caucus.
The social democratic Co-operative Commonwealth Federation (CCF), led by Donald C. MacDonald, won one additional seat, for a total of three.
The Labor-Progressive Party (which was the Communist Party) lost its last remaining seat with the defeat of J.B. Salsberg.
James Shannon Dempsey (Renfrew South) had his endorsement as a PC candidate withdrawn because of controversy over a political gift,[2] but he was reelected as an Independent PC.
Pre-election developments
Franchise reform
The Election Act, 1951[3] was significantly amended in 1954,[4] providing for the following changes to the right to vote in Ontario:
- removal of the disqualification from voting for having been paid to act on behalf of a candidate[5]
- removal of the disqualification from voting for being an inmate maintained in a home for the aged or a house of industry[6]
- extension of the franchise to all Indians living in the province, whether enfranchised or not under the Indian Act[7]
- removal from the voters' list for temporary absence because of being a student, a mariner, or a member of the Canadian, Commonwealth or allied forces[8]
Expansion of Legislative Assembly
For the first time since the 1934 election, the number of seats in the Legislature was adjusted, rising from 90 to 98.[9] The following changes were made:
- Addington became Frontenac—Addington
- London was divided into London North and London South
- Muskoka—Ontario was reduced to Muskoka, ceding its part of Ontario County to Ontario
- Nickel Belt was separated from Sudbury
- Oshawa was separated from Ontario
- Ottawa West was carved out from Carleton
- Wellington North became Wellington—Dufferin
- Part of Wentworth became Wentworth East
- York Centre was carved out from York North
- York—Humber was separated from York West
- York—Scarborough was ceded from York East
Campaign
| Candidates | PC | Lib | LL | CCF | I-PC | Lab-Pr | Ind | I-Lib | SC | S-Lab | Total |
|---|---|---|---|---|---|---|---|---|---|---|---|
| 2 | 17 | 16 | 1 | 34 | |||||||
| 3 | 46 | 44 | 2 | 46 | 1 | 1 | 1 | 141 | |||
| 4 | 31 | 31 | 31 | 27 | 4 | 124 | |||||
| 5 | 3 | 3 | 3 | 3 | 1 | 1 | 1 | 15 | |||
| Total | 97 | 94 | 2 | 81 | 1 | 31 | 5 | 1 | 1 | 1 | 314 |
Results
| Political party | Party leader | MPPs | Votes | |||||||
|---|---|---|---|---|---|---|---|---|---|---|
| Candidates | 1951 | Dissol. | 1955 | ± | # | % | ± (pp) | |||
| Progressive Conservative | Leslie Frost | 97 | 79 | 83 | 4 |
846,592 | 48.06% | 0.40 | ||
| Liberal | Farquhar Oliver | 94 | 7 | 10 | 3 |
577,774 | 32.80% | 1.74 | ||
| Co-operative Commonwealth | Donald C. MacDonald | 81 | 2 | 3 | 1 |
291,410 | 16.54% | 2.56 | ||
| Labor–Progressive | Stewart Smith | 31 | 1 | – | 1 |
20,875 | 1.19% | 0.52 | ||
| Liberal–Labour | 2 | 1 | 1 | 7,305 | 0.41% | 0.04 | ||||
| Independent PC | 1 | – | – | 1 | 1 |
7,033 | 0.40% | 0.34 | ||
| Independent | 5 | – | – | – | 9,169 | 0.52% | 0.41 | |||
| Independent Liberal | 1 | – | – | – | 641 | 0.04% | New | |||
| Independent Social Credit | 1 | – | – | – | 602 | 0.03% | New | |||
| Socialist Labour | 1 | – | – | – | 124 | 0.01% | ||||
| Independent Labour | – | – | – | – | Did not campaign | |||||
| Vacant | ||||||||||
| Total | 314 | 90 | 90 | 98 | 1,761,525 | 100.00% | ||||
| Blank and invalid ballots | 22,622 | |||||||||
| Registered voters / turnout | 2,905,760 | 61.40% | 4.17 | |||||||
| Party | Seats | Votes | Change (pp) | ||
|---|---|---|---|---|---|
| █ Progressive Conservative | 83 / 98 | 48.06% | -0.40 | ||
| █ Liberal | 10 / 98 | 32.80% | 1.74 | ||
| █ Co-operative Commonwealth | 3 / 98 | 16.54% | -2.56 | ||
| █ Other | 2 / 98 | 2.60% | 1.22 | ||
Synopsis of results
| Riding | Winning party | Turnout [a 1] |
Votes | |||||||||||||
|---|---|---|---|---|---|---|---|---|---|---|---|---|---|---|---|---|
| Name[a 2] | 1951 | Party | Votes | Share | Margin # |
Margin % |
PC/UPC | Lib/LL | CCF | Lab-Pr | Ind | Oth | Total | |||
| Algoma—Manitoulin | PC | PC | 5,725 | 44.37% | 900 | 6.98% | 69.54% | 5,725 | 4,825 | 2,352 | – | – | – | 12,902 | ||
| Brant | Lib | Lib | 8,582 | 52.06% | 3,251 | 19.72% | 60.28% | 5,331 | 8,582 | 2,571 | – | – | – | 16,484 | ||
| Brantford | Lib | Lib | 7,110 | 39.55% | 372 | 2.07% | 71.81% | 6,738 | 7,110 | 3,928 | 200 | – | – | 17,976 | ||
| Bruce | PC | Lib | 8,609 | 54.43% | 1,918 | 12.13% | 83.40% | 6,691 | 8,609 | 518 | – | – | – | 15,818 | ||
| Carleton | PC | PC | 5,153 | 63.65% | 2,210 | 27.30% | 55.97% | 5,153 | 2,943 | – | – | – | – | 8,096 | ||
| Cochrane North | PC | PC | 5,943 | 54.02% | 3,310 | 30.09% | 64.55% | 5,943 | 2,425 | 2,633 | – | – | – | 11,001 | ||
| Cochrane South | CCF | PC | 11,904 | 49.43% | 612 | 2.54% | 65.23% | 11,904 | – | 11,292 | 887 | – | – | 24,083 | ||
| Dufferin—Simcoe | PC | PC | 7,778 | 62.09% | 3,731 | 29.78% | 57.70% | 7,778 | 4,047 | 702 | – | – | – | 12,527 | ||
| Durham | PC | PC | 6,939 | 53.36% | 2,327 | 17.89% | 67.15% | 6,939 | 4,612 | 1,454 | – | – | – | 13,005 | ||
| Elgin | PC | PC | 9,741 | 60.89% | 5,387 | 33.68% | 59.40% | 9,741 | 4,354 | 1,902 | – | – | – | 15,997 | ||
| Essex North | Lib | Lib | 10,200 | 38.79% | 649 | 2.47% | 66.30% | 9,551 | 10,200 | 6,546 | – | – | – | 26,297 | ||
| Essex South | PC | PC | 8,080 | 56.71% | 1,912 | 13.42% | 60.45% | 8,080 | 6,168 | – | – | – | – | 14,248 | ||
| Fort William | PC | PC | 8,868 | 46.78% | 3,950 | 20.84% | 71.05% | 8,868 | 4,788 | 4,918 | 383 | – | – | 18,957 | ||
| Frontenac—Addington[a 3] | PC | PC | 6,508 | 62.39% | 3,114 | 29.85% | 65.67% | 6,508 | 3,394 | 529 | – | – | – | 10,431 | ||
| Glengarry | PC | PC | 5,635 | 61.48% | 2,104 | 22.95% | 74.41% | 5,635 | 3,531 | – | – | – | – | 9,166 | ||
| Grenville—Dundas | PC | PC | 7,921 | 63.56% | 3,379 | 27.11% | 59.61% | 7,921 | 4,542 | – | – | – | – | 12,463 | ||
| Grey North | PC | PC | 8,910 | 52.74% | 1,876 | 11.10% | 81.23% | 8,910 | 7,034 | 950 | – | – | – | 16,894 | ||
| Grey South | Lib | Lib | 6,800 | 51.58% | 1,621 | 12.30% | 81.48% | 5,179 | 6,800 | 1,204 | – | – | – | 13,183 | ||
| Haldimand—Norfolk | PC | PC | 12,914 | 56.73% | 4,074 | 17.90% | 71.41% | 12,914 | 8,840 | 1,011 | – | – | – | 22,765 | ||
| Halton | PC | PC | 8,373 | 47.31% | 2,461 | 13.90% | 54.89% | 8,373 | 5,912 | 3,414 | – | – | – | 17,699 | ||
| Hamilton Centre | PC | PC | 8,427 | 44.72% | 2,580 | 13.69% | 47.08% | 8,427 | 3,688 | 5,847 | 882 | – | – | 18,844 | ||
| Hamilton East | PC | PC | 7,444 | 36.13% | 854 | 4.14% | 56.90% | 7,444 | 5,898 | 6,590 | 674 | – | – | 20,606 | ||
| Hamilton—Wentworth | PC | PC | 9,769 | 58.69% | 5,713 | 34.32% | 57.75% | 9,769 | 4,056 | 2,467 | 354 | – | – | 16,646 | ||
| Hastings East | PC | PC | 5,999 | 60.47% | 2,481 | 25.01% | 66.70% | 5,999 | 3,518 | 403 | – | – | – | 9,920 | ||
| Hastings West | PC | PC | 11,017 | 60.95% | 5,219 | 28.88% | 63.67% | 11,017 | 5,798 | 1,259 | – | – | – | 18,074 | ||
| Huron | PC | PC | 7,890 | 55.27% | 1,505 | 10.54% | 79.31% | 7,890 | 6,385 | – | – | – | – | 14,275 | ||
| Huron—Bruce | PC | PC | 7,244 | 55.67% | 1,475 | 11.33% | 81.18% | 7,244 | 5,769 | – | – | – | – | 13,013 | ||
| Kenora | LL | LL | 5,266 | 42.22% | 128 | 1.03% | 65.83% | 5,138 | 5,266[a 4] | 2,068 | – | – | – | 12,472 | ||
| Kent East | PC | Lib | 6,940 | 52.76% | 725 | 5.51% | 77.99% | 6,215 | 6,940 | – | – | – | – | 13,155 | ||
| Kent West | PC | PC | 10,399 | 54.58% | 3,272 | 17.17% | 58.04% | 10,399 | 7,127 | 1,526 | – | – | – | 19,052 | ||
| Kingston* | PC | PC | 10,614 | 57.09% | 3,364 | 18.09% | 65.38% | 10,614 | 7,250 | 728 | – | – | – | 18,592 | ||
| Lambton East | PC | PC | 6,855 | 56.41% | 1,557 | 12.81% | 71.53% | 6,855 | 5,298 | – | – | – | – | 12,153 | ||
| Lambton West | PC | PC | 10,767 | 56.45% | 4,924 | 25.82% | 59.81% | 10,767 | 5,843 | 2,462 | – | – | – | 19,072 | ||
| Lanark | PC | PC | 11,206 | 74.85% | 7,441 | 49.70% | 68.90% | 11,206 | 3,765 | – | – | – | – | 14,971 | ||
| Leeds | PC | PC | 10,632 | 63.34% | 4,479 | 26.68% | 68.96% | 10,632 | 6,153 | – | – | – | – | 16,785 | ||
| Lincoln | PC | PC | 15,903 | 50.28% | 5,204 | 16.45% | 54.94% | 15,903 | 10,699 | 3,869 | 519 | – | 641 | 31,631 | ||
| London North | New | PC | 9,022 | 47.70% | 1,648 | 8.71% | 61.21% | 9,022 | 7,374 | 2,518 | – | – | – | 18,914 | ||
| London South | New | PC | 8,735 | 45.85% | 2,504 | 13.14% | 53.69% | 8,735 | 6,231 | 3,489 | 595 | – | – | 19,050 | ||
| Middlesex North | PC | PC | 5,077 | 51.38% | 563 | 5.70% | 74.36% | 5,077 | 4,514 | 291 | – | – | – | 9,882 | ||
| Middlesex South | PC | PC | 9,434 | 56.72% | 2,235 | 13.44% | 67.64% | 9,434 | 7,199 | – | – | – | – | 16,633 | ||
| Muskoka | PC | PC | 5,256 | 47.63% | 535 | 4.85% | 77.27% | 5,256 | 4,721 | 1,058 | – | – | – | 11,035 | ||
| Niagara Falls | Lib | PC | 10,354 | 48.72% | 2,078 | 9.78% | 57.67% | 10,354 | 8,276 | 2,305 | 316 | – | – | 21,251 | ||
| Nickel Belt | New | PC | 7,088 | 37.98% | 1,913 | 10.25% | 71.14% | 7,088 | 5,175 | 2,039 | – | 4,359 | – | 18,661 | ||
| Nipissing | PC | PC | 8,723 | 51.04% | 3,708 | 21.69% | 60.56% | 8,723 | 5,015 | 2,965 | – | 389 | – | 17,092 | ||
| Northumberland | PC | PC | 10,200 | 63.20% | 4,767 | 29.54% | 75.12% | 10,200 | 5,433 | 507 | – | – | – | 16,140 | ||
| Ontario | CCF | PC | 7,248 | 49.97% | 1,882 | 12.97% | 69.05% | 7,248 | 5,366 | 1,892 | – | – | – | 14,506 | ||
| Oshawa | New | CCF | 9,114 | 41.16% | 2,313 | 10.45% | 61.80% | 6,801 | 5,966 | 9,114 | 261 | – | – | 22,142 | ||
| Ottawa East | Lib | PC | 8,688 | 51.32% | 1,102 | 6.51% | 47.03% | 8,688 | 7,586 | 654 | – | – | – | 16,928 | ||
| Ottawa South | PC | PC | 14,151 | 53.94% | 3,167 | 12.07% | 53.21% | 14,151 | 10,984 | 826 | 273 | – | – | 26,234 | ||
| Ottawa West | New | PC | 8,513 | 57.90% | 3,467 | 23.58% | 56.76% | 8,513 | 5,046 | 1,144 | – | – | – | 14,703 | ||
| Oxford | PC | Lib | 11,781 | 48.03% | 1,053 | 4.29% | 72.69% | 10,728 | 11,781 | 2,017 | – | – | – | 24,526 | ||
| Parry Sound | PC | PC | 6,492 | 59.58% | 3,650 | 33.50% | 69.78% | 6,492 | 2,842 | 1,562 | – | – | – | 10,896 | ||
| Peel | PC | PC | 13,296 | 50.56% | 4,600 | 17.49% | 60.38% | 13,296 | 8,696 | 4,305 | – | – | – | 26,297 | ||
| Perth | PC | PC | 12,247 | 53.43% | 1,574 | 6.87% | 69.17% | 12,247 | 10,673 | – | – | – | – | 22,920 | ||
| Peterborough | PC | PC | 11,561 | 51.63% | 3,652 | 16.31% | 58.97% | 11,561 | 7,909 | 2,920 | – | – | – | 22,390 | ||
| Port Arthur | PC | PC | 9,517 | 42.52% | 1,776 | 7.94% | 68.38% | 9,517 | 4,347 | 7,741 | 775 | – | – | 22,380 | ||
| Prescott | PC | PC | 6,385 | 60.26% | 2,175 | 20.53% | 65.85% | 6,385 | 4,210 | – | – | – | – | 10,595 | ||
| Prince Edward—Lennox | PC | PC | 7,003 | 60.29% | 2,390 | 20.58% | 59.15% | 7,003 | 4,613 | – | – | – | – | 11,616 | ||
| Rainy River | PC | PC | 4,977 | 60.08% | 2,938 | 35.47% | 67.86% | 4,977 | 2,039 | 1,268 | – | – | – | 8,284 | ||
| Renfrew North | PC | PC | 8,215 | 52.34% | 2,147 | 13.68% | 70.34% | 8,215 | 6,068 | 1,411 | – | – | – | 15,694 | ||
| Renfrew South | PC | I-PC | 7,033 | 50.72% | 708 | 5.11% | 77.83% | 7,033[a 5] | 6,325 | 509 | – | – | – | 13,867 | ||
| Russell | PC | PC | 10,392 | 65.27% | 4,862 | 30.54% | 43.05% | 10,392 | 5,530 | – | – | – | – | 15,922 | ||
| Stormont | Lib | Lib | 10,577 | 55.51% | 2,702 | 14.18% | 66.60% | 7,875 | 10,577 | – | – | – | 602 | 19,054 | ||
| Sault Ste. Marie | PC | PC | 7,716 | 41.77% | 1,931 | 10.45% | 63.68% | 7,716 | 4,517 | 5,785 | 453 | – | – | 18,471 | ||
| Simcoe Centre | PC | PC | 8,305 | 57.39% | 2,139 | 14.78% | 62.45% | 8,305 | 6,166 | – | – | – | – | 14,471 | ||
| Simcoe East | PC | PC | 8,436 | 54.69% | 2,792 | 18.10% | 66.83% | 8,436 | 5,644 | 1,346 | – | – | – | 15,426 | ||
| Sudbury | PC | PC | 8,957 | 39.73% | 980 | 4.35% | 71.08% | 8,957 | 7,977 | 1,657 | – | 3,954 | – | 22,545 | ||
| Temiskaming | PC | PC | 6,322 | 60.24% | 2,150 | 20.49% | 73.63% | 6,322 | – | 4,172 | – | – | – | 10,494 | ||
| Victoria | PC | PC | 10,630 | 69.61% | 7,455 | 48.82% | 68.59% | 10,630 | 3,175 | 1,465 | – | – | – | 15,270 | ||
| Waterloo North | PC | Lib | 14,436 | 44.65% | 2,160 | 6.68% | 62.50% | 12,276 | 14,436 | 5,623 | – | – | – | 32,335 | ||
| Waterloo South | PC | PC | 8,290 | 39.97% | 1,755 | 8.46% | 68.98% | 8,290 | 5,915 | 6,535 | – | – | – | 20,740 | ||
| Welland | PC | PC | 11,815 | 44.33% | 2,409 | 9.04% | 66.90% | 11,815 | 9,406 | 4,645 | 787 | – | – | 26,653 | ||
| Wellington—Dufferin[a 6] | PC | PC | 7,720 | 53.53% | 1,651 | 11.45% | 77.71% | 7,720 | 6,069 | 634 | – | – | – | 14,423 | ||
| Wellington South | PC | Lib | 9,924 | 48.38% | 1,968 | 9.59% | 76.20% | 7,956 | 9,924 | 2,634 | – | – | – | 20,514 | ||
| Wentworth | PC | PC | 6,821 | 40.77% | 1,437 | 8.59% | 57.81% | 6,821 | 5,384 | 4,201 | 324 | – | – | 16,730 | ||
| Wentworth East | New | CCF | 6,505 | 41.44% | 1,949 | 12.42% | 51.34% | 4,556 | 4,294 | 6,505 | 341 | – | – | 15,696 | ||
| Windsor—Walkerville | PC | PC | 7,289 | 47.22% | 2,880 | 18.66% | 61.46% | 7,289 | 3,140 | 4,409 | 598 | – | – | 15,436 | ||
| Windsor—Sandwich | PC | PC | 10,186 | 54.42% | 5,911 | 31.58% | 52.50% | 10,186 | 4,275 | 4,256 | – | – | – | 18,717 | ||
| York Centre | New | PC | 12,731 | 37.72% | 1,105 | 3.27% | 56.94% | 12,731 | 11,626 | 8,742 | 656 | – | – | 33,755 | ||
| York East | PC | PC | 18,931 | 45.86% | 7,563 | 18.32% | 52.69% | 18,931 | 11,368 | 10,982 | – | – | – | 41,281 | ||
| York—Humber | New | PC | 11,806 | 44.25% | 4,098 | 15.36% | 58.03% | 11,806 | 7,708 | 6,261 | 908 | – | – | 26,683 | ||
| York North | PC | PC | 11,301 | 48.74% | 2,672 | 11.53% | 55.12% | 11,301 | 8,629 | 3,254 | – | – | – | 23,184 | ||
| York—Scarborough | New | PC | 13,806 | 42.22% | 1,525 | 4.66% | 53.82% | 13,806 | 12,281 | 6,287 | 330 | – | – | 32,704 | ||
| York South | PC | CCF | 13,877 | 44.03% | 1,426 | 4.52% | 50.57% | 12,451 | 4,168 | 13,877 | 1,019 | – | – | 31,515 | ||
| York West | PC | PC | 14,372 | 45.79% | 4,197 | 13.37% | 55.04% | 14,372 | 6,837 | 10,175 | – | – | – | 31,384 | ||
| Beaches | PC | PC | 7,965 | 48.12% | 1,966 | 11.88% | 58.07% | 7,965 | 2,589 | 5,999 | – | – | – | 16,553 | ||
| Bellwoods | PC | PC | 5,330 | 38.43% | 233 | 1.68% | 62.97% | 5,330 | 5,097 | 1,875 | 1,567 | – | – | 13,869 | ||
| Bracondale | PC | PC | 4,727 | 40.40% | 1,333 | 11.39% | 55.24% | 4,727 | 2,991 | 3,394 | 588 | – | – | 11,700 | ||
| Dovercourt | PC | PC | 6,288 | 36.12% | 383 | 2.20% | 55.92% | 6,288 | 4,655 | 5,905 | 560 | – | – | 17,408 | ||
| Eglinton | PC | PC | 15,954 | 55.70% | 5,996 | 20.93% | 58.95% | 15,954 | 9,958 | 2,417 | – | 315 | – | 28,644 | ||
| High Park | PC | PC | 7,723 | 42.39% | 2,054 | 11.27% | 58.74% | 7,723 | 4,392 | 5,669 | 435 | – | – | 18,219 | ||
| Parkdale | PC | PC | 7,503 | 36.92% | 730 | 3.59% | 55.04% | 7,503 | 6,773 | 5,503 | 542 | – | – | 20,321 | ||
| Riverdale | PC | PC | 8,771 | 47.14% | 3,623 | 19.47% | 53.44% | 8,771 | 4,236 | 5,148 | 329 | – | 124 | 18,608 | ||
| St. Andrew | Lab-Pr | PC | 5,019 | 41.50% | 743 | 6.14% | 60.93% | 5,019 | 1,228 | 1,420 | 4,276 | 152 | – | 12,095 | ||
| St. David | PC | PC | 5,747 | 37.18% | 561 | 3.63% | 59.19% | 5,747 | 4,299 | 5,186 | 227 | – | – | 15,459 | ||
| St. George | PC | PC | 7,593 | 54.86% | 4,119 | 29.76% | 47.64% | 7,593 | 3,474 | 2,773 | – | – | – | 13,840 | ||
| St. Patrick | PC | PC | 5,165 | 54.60% | 2,754 | 29.12% | 51.56% | 5,165 | 2,411 | 1,548 | 335 | – | – | 9,459 | ||
| Woodbine | PC | PC | 8,755 | 43.65% | 1,305 | 6.51% | 56.18% | 8,755 | 3,372 | 7,450 | 481 | – | – | 20,058 | ||
- including spoilt ballots
- order is as given in EO reports
- formerly Addington
- Albert Wren was already a member of the Legislature
- James Shannon Dempsey was a PC MPP in the previous Legislature
- formerly Wellington North
- = open seat
- = turnout is above provincial average
- = winning candidate was in previous Legislature
- = previously incumbent in another riding
- = incumbency arose from byelection gain
- = incumbent had switched allegiance
- = other incumbents renominated
- = unendorsed PC candidate
- = Liberal-Labour candidate
Analysis
| Party in 1st place | Party in 2nd place | Total | |||||
|---|---|---|---|---|---|---|---|
| PC | Lib | LL | CCF | LP | |||
| Progressive Conservative | 63 | 1 | 18 | 1 | 83 | ||
| Liberal | 10 | 10 | |||||
| Liberal–Labour | 1 | 1 | |||||
| Co-operative Commonwealth | 3 | 3 | |||||
| Independent PC | 1 | 1 | |||||
| Total | 14 | 64 | 1 | 18 | 1 | 98 | |
| Parties | 1st | 2nd | 3rd | 4th | 5th |
|---|---|---|---|---|---|
| █ Progressive Conservative | 83 | 14 | |||
| █ Liberal | 10 | 64 | 19 | 1 | |
| █ Co-operative Commonwealth | 3 | 18 | 58 | 2 | |
| █ Liberal–Labour | 1 | 1 | |||
| █ Independent PC | 1 | ||||
| █ Labor–Progressive | 1 | 1 | 28 | 1 | |
| █ Independent | 2 | 2 | 1 | ||
| █ Social Credit | 1 | ||||
| █ Independent Liberal | 1 | ||||
| █ Socialist Labour | 1 |
| Source | Party | ||||||
|---|---|---|---|---|---|---|---|
| PC | Lib | Lib-Lab | CCF | Ind-PC | Total | ||
| Seats retained | Incumbents returned | 65 | 5 | 1 | 71 | ||
| Open seats held | 6 | 6 | |||||
| Seats changing hands | Incumbents defeated | 3 | 5 | 1 | 9 | ||
| Open seats gained | 1 | 1 | |||||
| Byelection gains held | 1 | 1 | |||||
| Incumbent changed allegiance | 1 | 1 | |||||
| New ridings | Incumbent returned in new seat | 2 | 1 | 3 | |||
| New MPP elected | 5 | 1 | 6 | ||||
| Total | 83 | 10 | 1 | 3 | 1 | 98 | |
Reorganization of ridings
The reorganized ridings returned the following MLAs:
See also
References
- "1955 General Election". Elections Ontario. Retrieved January 3, 2021.
- O'Hearn, Don (May 19, 1955). "Dempsey Case Rocks Legislation". Daily Times-Gazette. Oshawa. p. 6.
- The Election Act, 1951, S.O. 1951, c. 21
- The Election Amendment Act, 1954, S.O. 1954, c. 25
- 1954 Act, s. 2
- 1954 Act, s. 3
- 1954 Act, ss. 4, 5
- 1954 Act, s. 5
- The Representation Act, 1954, S.O. 1954, c. 84
- "1955 general election results". Elections Ontario. Retrieved October 9, 2023.
| General elections | |
|---|---|
| By-elections | |
| Municipal elections | |
| Referendums | |