1983 Canarian Island Cabildo elections
The 1983 Canarian Island Cabildo elections were held on Sunday, 8 May 1983, to elect the 2nd Island Cabildos of El Hierro, Fuerteventura, Gran Canaria, La Gomera, La Palma, Lanzarote and Tenerife. All 137 seats in the seven Island Cabildos were up for election. The elections were held simultaneously with regional elections in thirteen autonomous communities and local elections all throughout Spain.
Overall
| Parties and alliances | Popular vote | Seats | ||||
|---|---|---|---|---|---|---|
| Votes | % | ±pp | Total | +/− | ||
| Spanish Socialist Workers' Party (PSOE) | 221,611 | 38.41 | +20.25 | 51 | +25 | |
| People's Coalition (AP–PDP–UL)1 | 148,185 | 25.68 | +22.65 | 34 | +32 | |
| Tenerife Group of Independents (ATI) | 48,960 | 8.49 | New | 6 | +6 | |
| Canarian People's Union–Canarian Assembly (UPC–AC)2 | 41,515 | 7.20 | –13.27 | 4 | –6 | |
| Democratic and Social Centre (CDS) | 34,808 | 6.03 | New | 10 | +10 | |
| Liberal Canarian Party (PCL) | 25,613 | 4.44 | New | 3 | +3 | |
| Communist Party of the Canaries (PCC–PCE) | 24,101 | 4.18 | –1.40 | 4 | ±0 | |
| Party of the Canarian Country (PPC) | 8,171 | 1.42 | +0.05 | 0 | ±0 | |
| Majorera Assembly (AM) | 5,692 | 0.99 | –0.01 | 9 | ±0 | |
| Gomera Group of Independents (AGI) | 3,499 | 0.61 | New | 5 | +5 | |
| Independents of Fuerteventura (IF) | 3,481 | 0.60 | New | 5 | +5 | |
| Assembly (Tagoror) | 2,562 | 0.44 | +0.20 | 0 | –1 | |
| Independent Herrenian Group (AHI) | 1,879 | 0.33 | ±0.00 | 6 | ±0 | |
| Seven Green Stars (SEV) | 1,803 | 0.31 | New | 0 | ±0 | |
| Popular Struggle Coalition (CLP) | 1,243 | 0.22 | New | 0 | ±0 | |
| Popular Front of the Canaries (FPC) | 760 | 0.13 | n/a | 0 | ±0 | |
| Canarian Nationalist Party (PNC) | 193 | 0.03 | New | 0 | ±0 | |
| Union of the Democratic Centre (UCD) | n/a | n/a | –48.61 | 0 | –79 | |
| Blank ballots | 2,870 | 0.50 | –0.03 | |||
| Total | 576,946 | 137 | ±0 | |||
| Valid votes | 576,946 | 97.71 | –0.56 | |||
| Invalid votes | 13,498 | 2.29 | +0.56 | |||
| Votes cast / turnout | 590,444 | 63.08 | +5.42 | |||
| Abstentions | 345,533 | 36.92 | –5.42 | |||
| Registered voters | 935,977 | |||||
| Sources[1][2][3] | ||||||
Footnotes:
| ||||||
Island Cabildo control
The following table lists party control in the Island Cabildos.[1] Gains for a party are displayed with the cell's background shaded in that party's colour.
| Cabildo | Previous control | New control | ||
|---|---|---|---|---|
| El Hierro | Independent Herrenian Group (AHI) | Independent Herrenian Group (AHI) | ||
| Fuerteventura | Majorera Assembly (AM) | Majorera Assembly (AM) | ||
| Gran Canaria | Union of the Democratic Centre (UCD) | Spanish Socialist Workers' Party (PSOE) | ||
| La Gomera | Gomera Group of Independents (AGI) | Gomera Group of Independents (AGI) | ||
| La Palma | People's Coalition (AP–PDP–UL) | People's Coalition (AP–PDP–UL) | ||
| Lanzarote | Union of the Democratic Centre (UCD) | Spanish Socialist Workers' Party (PSOE) | ||
| Tenerife | Tenerife Group of Independents (ATI) | Spanish Socialist Workers' Party (PSOE) | ||
Islands
El Hierro
 | ||||||
| Parties and alliances | Popular vote | Seats | ||||
|---|---|---|---|---|---|---|
| Votes | % | ±pp | Total | +/− | ||
| Independent Herrenian Group (AHI) | 1,879 | 54.69 | +0.77 | 6 | ±0 | |
| People's Coalition (AP–PDP–UL)1 | 880 | 25.61 | +24.87 | 3 | +3 | |
| Spanish Socialist Workers' Party (PSOE) | 666 | 19.38 | New | 2 | +2 | |
| Union of the Democratic Centre (UCD) | n/a | n/a | –44.96 | 0 | –5 | |
| Blank ballots | 11 | 0.32 | –0.07 | |||
| Total | 3,436 | 11 | ±0 | |||
| Valid votes | 3,436 | 99.22 | –0.36 | |||
| Invalid votes | 27 | 0.78 | +0.36 | |||
| Votes cast / turnout | 3,463 | 70.39 | +16.18 | |||
| Abstentions | 1,483 | 29.61 | –16.18 | |||
| Registered voters | 4,920 | |||||
| Sources[1][2][3] | ||||||
Footnotes:
| ||||||
Fuerteventura
 | ||||||
| Parties and alliances | Popular vote | Seats | ||||
|---|---|---|---|---|---|---|
| Votes | % | ±pp | Total | +/− | ||
| Majorera Assembly (AM) | 5,692 | 45.93 | –3.61 | 9 | ±0 | |
| Independents of Fuerteventura (IF) | 3,481 | 28.09 | New | 5 | +5 | |
| Spanish Socialist Workers' Party (PSOE) | 1,243 | 10.03 | +4.43 | 1 | ±0 | |
| People's Coalition (AP–PDP–UL)1 | 1,086 | 8.76 | –0.21 | 1 | ±0 | |
| Democratic and Social Centre (CDS) | 874 | 7.05 | New | 1 | +1 | |
| Union of the Democratic Centre (UCD) | n/a | n/a | –35.82 | 0 | –6 | |
| Blank ballots | 17 | 0.14 | +0.07 | |||
| Total | 12,393 | 17 | ±0 | |||
| Valid votes | 12,393 | 98.54 | –1.03 | |||
| Invalid votes | 183 | 1.46 | +1.03 | |||
| Votes cast / turnout | 12,576 | 66.14 | +1.34 | |||
| Abstentions | 6,439 | 33.86 | –1.34 | |||
| Registered voters | 19,015 | |||||
| Sources[1][2][3] | ||||||
Footnotes:
| ||||||
Gran Canaria
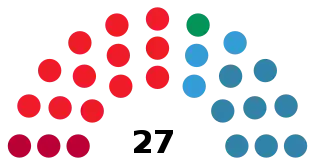 | ||||||
| Parties and alliances | Popular vote | Seats | ||||
|---|---|---|---|---|---|---|
| Votes | % | ±pp | Total | +/− | ||
| Spanish Socialist Workers' Party (PSOE) | 96,488 | 37.29 | +24.45 | 12 | +9 | |
| People's Coalition (AP–PDP–UL)1 | 71,516 | 27.64 | +27.15 | 8 | +8 | |
| Canarian People's Union–Canarian Assembly (UPC–AC)2 | 26,684 | 10.31 | –20.56 | 3 | –4 | |
| Liberal Canarian Party (PCL) | 25,613 | 9.90 | New | 3 | +3 | |
| Democratic and Social Centre (CDS) | 13,515 | 5.22 | New | 1 | +1 | |
| Communist Party of the Canaries (PCC–PCE) | 12,269 | 4.74 | –0.30 | 0 | ±0 | |
| Party of the Canarian Country (PPC) | 8,171 | 3.16 | +0.39 | 0 | ±0 | |
| Assembly (Tagoror) | 1,619 | 0.63 | New | 0 | ±0 | |
| Popular Struggle Coalition (CLP) | 1,243 | 0.48 | New | 0 | ±0 | |
| Union of the Democratic Centre (UCD) | n/a | n/a | –47.46 | 0 | –17 | |
| Blank ballots | 1,644 | 0.64 | +0.11 | |||
| Total | 258,762 | 27 | ±0 | |||
| Valid votes | 258,762 | 96.79 | –1.11 | |||
| Invalid votes | 8,573 | 3.21 | +1.11 | |||
| Votes cast / turnout | 267,335 | 63.17 | –5.27 | |||
| Abstentions | 155,852 | 36.83 | +5.27 | |||
| Registered voters | 423,187 | |||||
| Sources[1][2][3] | ||||||
Footnotes:
| ||||||
La Gomera
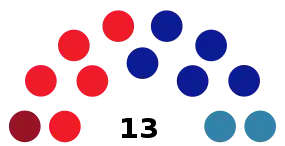 | ||||||
| Parties and alliances | Popular vote | Seats | ||||
|---|---|---|---|---|---|---|
| Votes | % | ±pp | Total | +/− | ||
| Gomera Group of Independents (AGI) | 3,499 | 39.80 | New | 5 | +5 | |
| Spanish Socialist Workers' Party (PSOE) | 3,316 | 37.72 | +0.76 | 5 | –1 | |
| People's Coalition (AP–PDP–UL) | 1,290 | 14.67 | New | 2 | +2 | |
| Communist Party of the Canaries (PCC–PCE) | 664 | 7.55 | –5.20 | 1 | –1 | |
| Union of the Democratic Centre (UCD) | n/a | n/a | –48.96 | 0 | –9 | |
| Blank ballots | 23 | 0.26 | +0.12 | |||
| Total | 8,792 | 13 | –4 | |||
| Valid votes | 8,792 | 99.15 | –0.14 | |||
| Invalid votes | 75 | 0.85 | +0.14 | |||
| Votes cast / turnout | 8,867 | 62.46 | +18.52 | |||
| Abstentions | 5,330 | 37.54 | –18.52 | |||
| Registered voters | 14,197 | |||||
| Sources[1][2][3] | ||||||
La Palma
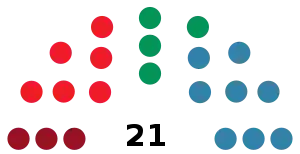 | ||||||
| Parties and alliances | Popular vote | Seats | ||||
|---|---|---|---|---|---|---|
| Votes | % | ±pp | Total | +/− | ||
| People's Coalition (AP–PDP–UL) | 12,623 | 36.36 | New | 8 | +8 | |
| Spanish Socialist Workers' Party (PSOE) | 10,772 | 31.03 | +10.60 | 6 | +2 | |
| Democratic and Social Centre (CDS) | 6,312 | 18.18 | New | 4 | +4 | |
| Communist Party of the Canaries (PCC–PCE) | 4,859 | 14.00 | –0.10 | 3 | +1 | |
| Union of the Democratic Centre (UCD) | n/a | n/a | –65.01 | 0 | –15 | |
| Blank ballots | 152 | 0.44 | –0.02 | |||
| Total | 34,718 | 21 | ±0 | |||
| Valid votes | 34,718 | 98.89 | +0.32 | |||
| Invalid votes | 391 | 1.11 | –0.32 | |||
| Votes cast / turnout | 35,109 | 61.60 | +7.91 | |||
| Abstentions | 21,887 | 38.40 | –7.91 | |||
| Registered voters | 56,996 | |||||
| Sources[1][2][3] | ||||||
Lanzarote
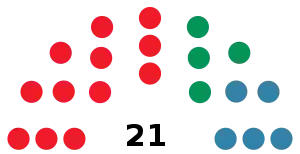 | ||||||
| Parties and alliances | Popular vote | Seats | ||||
|---|---|---|---|---|---|---|
| Votes | % | ±pp | Total | +/− | ||
| Spanish Socialist Workers' Party (PSOE) | 9,817 | 47.99 | +24.11 | 12 | +7 | |
| People's Coalition (AP–PDP–UL) | 4,064 | 19.87 | New | 5 | +5 | |
| Democratic and Social Centre (CDS) | 3,702 | 18.10 | New | 4 | +4 | |
| Assembly (Tagoror) | 943 | 4.61 | –2.46 | 0 | –1 | |
| Communist Party of the Canaries (PCC–PCE) | 878 | 4.29 | +0.78 | 0 | ±0 | |
| Popular Front of the Canaries (FPC) | 760 | 3.72 | n/a | 0 | ±0 | |
| Canarian Nationalist Party (PNC) | 193 | 0.94 | New | 0 | ±0 | |
| Union of the Democratic Centre (UCD) | n/a | n/a | –56.39 | 0 | –11 | |
| Blank ballots | 100 | 0.49 | +0.26 | |||
| Total | 20,457 | 21 | +4 | |||
| Valid votes | 20,457 | 98.58 | –0.55 | |||
| Invalid votes | 294 | 1.42 | +0.55 | |||
| Votes cast / turnout | 20,751 | 59.08 | +0.86 | |||
| Abstentions | 14,373 | 40.92 | –0.86 | |||
| Registered voters | 35,124 | |||||
| Sources[1][2][3] | ||||||
Tenerife
 | ||||||
| Parties and alliances | Popular vote | Seats | ||||
|---|---|---|---|---|---|---|
| Votes | % | ±pp | Total | +/− | ||
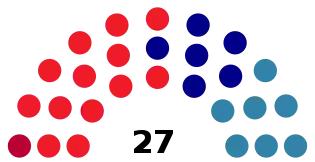
| Spanish Socialist Workers' Party (PSOE) | 99,309 | 41.66 | +17.08 | 13 | +6 | |
| People's Coalition (AP–PDP–UL)1 | 56,726 | 23.80 | +16.77 | 7 | +6 | |
| Tenerife Group of Independents (ATI) | 48,960 | 20.54 | New | 6 | +6 | |
| Canarian People's Union–Canarian Assembly (UPC–AC) | 14,831 | 6.22 | –7.46 | 1 | –2 | |
| Democratic and Social Centre (CDS) | 10,405 | 4.36 | New | 0 | ±0 | |
| Communist Party of the Canaries (PCC–PCE) | 5,431 | 2.28 | –2.94 | 0 | ±0 | |
| Seven Green Stars (SEV) | 1,803 | 0.76 | New | 0 | ±0 | |
| Union of the Democratic Centre (UCD) | n/a | n/a | –47.53 | 0 | –16 | |
| Blank ballots | 923 | 0.39 | –0.23 | |||
| Total | 238,388 | 27 | ±0 | |||
| Valid votes | 238,388 | 98.37 | –0.12 | |||
| Invalid votes | 3,955 | 1.63 | +0.12 | |||
| Votes cast / turnout | 242,343 | 63.35 | +14.99 | |||
| Abstentions | 140,195 | 36.65 | –14.99 | |||
| Registered voters | 382,538 | |||||
| Sources[1][2][3] | ||||||
Footnotes:
| ||||||
See also
References
- "Elecciones al Parlamento de Canarias (1983 - 2019)". Historia Electoral.com (in Spanish). Retrieved 30 March 2020.
- García Rojas, José Adrián (2003). Un caso de competencia electoral subestatal: la competencia electoral local en Canarias (1979-1999) (PDF) (in Spanish). Madrid: Universidad Complutense de Madrid. Facultad de Ciencias Políticas y Sociología. pp. 117–216 (Appendix). ISBN 84-669-2290-3. Retrieved 4 April 2020.
- "Election Results in the Canary Islands (1979-1987)" (PDF). datosdelanzarote.com (in Spanish). Statistics and Documentation Center of the Canary Islands. November 1987. Retrieved 23 June 2020.
This article is issued from Wikipedia. The text is licensed under Creative Commons - Attribution - Sharealike. Additional terms may apply for the media files.