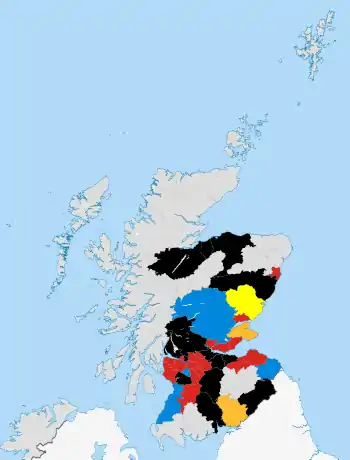
1992 Scottish local elections
Local elections were held in Scotland on 7 May 1992, to elect members to all 53 district councils. It was the last local election held under the Local Government (Scotland) Act 1973, which had established the two-tier system of regions and districts. Regional and district councils were abolished in 1996, and replaced with 29 new mainland unitary authorities under the terms of the Local Government etc. (Scotland) Act 1994.
| |||||||||||||||||||||||||||||||||||||||||||||||
| |||||||||||||||||||||||||||||||||||||||||||||||
 Colours denote the winning party with outright control | |||||||||||||||||||||||||||||||||||||||||||||||
Overview
Background
There was some speculation that these elections would be the last under the present two-tier system, as a review of council areas had been announced by the incumbent Conservative Government (The last elections were in fact the 1994 regional elections). The elections were seen as a test of the Conservative Government elected a month before in April, where the Conservatives had increased their vote share, much to the surprise of pollsters.
Outcome
The election saw a decrease in turnout of more than 5%, the lowest since District Council elections were introduced in 1974. The number of women candidates increased to 26.7%, although only 21.5% of elected councillors were women, showing that the main parties often preferred to nominate men in wards where they had a better chance of winning. Labour saw a sharp fall on their vote share, down 8.5% from 1988. The main beneficiaries of this decline were the Conservatives, up 3.8%, but still in third place behind the SNP, who gained 3.0%. The Liberal Democrats also made modest gains, taking a new record of 95 seats.
Regional Trends
Labour held most of their strongholds in the central belt, as well as Dundee and Aberdeen; even though their vote share decreased more in these areas (Such as East Lothian, down 13% from 1988 and Glasgow, down 11.8%) than elsewhere. The Conservatives were most successful in places were they hadn't stood many (if any) candidates before, such as Clackmannan (where the party only stood two candidates in 1988). Independents remained the largest party in rural areas, while the Liberal Democrats held their two councils of North East Fife and Annandale and Eskdale.[1]
National results
| Votes Total | Votes % | Seats | ||
|---|---|---|---|---|
| Labour | 504,076 | 34.0 | 468 | |
| SNP | 360,014 | 24.3 | 150 | |
| Conservative | 343,358 | 23.2 | 204 | |
| Liberal Democrats | 140,697 | 9.5 | 94 | |
| Independent | 107,586 | 7.4 | 228 | |
| Other | 26,057 | 1.9 | 14 | |
| Total | 1,481,788 | n/a | 1158 | |
Results by region
Borders
| District | 1988 result | 1992 result | Turnout | Details | ||
|---|---|---|---|---|---|---|
| Berwickshire | Conservative | Conservative | Details | |||
| Ettrick and Lauderdale | Independent | Independent | Details | |||
| Roxburgh | Independent | Independent | Details | |||
| Tweeddale | Independent | Independent | Details | |||
Central
| District | 1988 result | 1992 result | Turnout | Details | ||
|---|---|---|---|---|---|---|
| Clackmannan | Labour | Labour | Details | |||
| Falkirk | Labour | No overall control | Details | |||
| Stirling | Labour | No overall control | Details | |||
Dumfries and Galloway
| District | 1988 result | 1992 result | Turnout | Details | ||
|---|---|---|---|---|---|---|
| Annandale and Eskdale | Liberal Democrats | Liberal Democrats | Details | |||
| Wigtown | Independent | Independent | Details | |||
| Nithsdale | Labour | No overall control | Details | |||
| Stewartry | Independent | Independent | Details | |||
Fife
| District | 1988 result | 1992 result | Turnout | Details | ||
|---|---|---|---|---|---|---|
| Dunfermline | Labour | Labour | Details | |||
| Kirkcaldy | Labour | Labour | Details | |||
| North-East Fife | Liberal Democrats | Liberal Democrats | Details | |||
Grampian
| District | 1988 result | 1992 result | Turnout | Details | ||
|---|---|---|---|---|---|---|
| Banff and Buchan | Independent | Independent | Details | |||
| City of Aberdeen | No overall control | Labour | Details | |||
| Gordon | No overall control | Independent | Details | |||
| Kincardine and Deeside | Independent | No overall control | Details | |||
| Moray | Independent | No overall control | Details | |||
Highland
Lothian
| District | 1988 result | 1992 result | Turnout | Details | ||
|---|---|---|---|---|---|---|
| City of Edinburgh | Labour | No overall control | Details | |||
| East Lothian | Labour | Labour | Details | |||
| Midlothian | Labour | Labour | Details | |||
| West Lothian | Labour | No overall control | Details | |||
Strathclyde
Tayside
| District | 1988 result | 1992 result | Turnout | Details | ||
|---|---|---|---|---|---|---|
| Angus | SNP | SNP | Details | |||
| City of Dundee | Labour | Labour | Details | |||
| Perth and Kinross | No overall control | Conservative | Details | |||
References
- "Scottish District Elections 1992" (PDF). Elections Centre. Retrieved 11 January 2020.
- Denver, David; Bochel, Hugh (Winter 2000), "The Forgotten Elections: The Scottish Council Elections of 1999", Scottish Affairs (PDF), vol. 30, archived from the original (PDF) on 3 October 2011, retrieved 16 July 2011McConnell, Alan (2004), Scottish Local Government, Edinburgh University Press, ISBN 978-0-7486-2005-0
_Neal_Kinnoch_%252C_k%252C_Bestanddeelnr_932-9811.jpg.webp)
.jpg.webp)
.jpg.webp)
