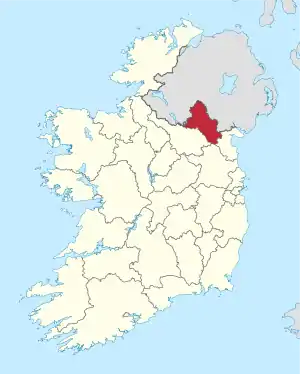
1999 Monaghan County Council election
An election to Monaghan County Council took place on 10 June 1999 as part of that year's Irish local elections. 20 councillors were elected from four local electoral areas for a five-year term of office on the system of proportional representation by means of the single transferable vote (PR-STV).
| |||||||||||||||||||||||||||||||||
All 20 seats to Monaghan County Council | |||||||||||||||||||||||||||||||||
|---|---|---|---|---|---|---|---|---|---|---|---|---|---|---|---|---|---|---|---|---|---|---|---|---|---|---|---|---|---|---|---|---|---|
| |||||||||||||||||||||||||||||||||
 Map showing the area of Monaghan County Council | |||||||||||||||||||||||||||||||||
| |||||||||||||||||||||||||||||||||
Results by party
| Party | Seats | ± | First Pref. votes | FPv% | ±% | |
|---|---|---|---|---|---|---|
| Fianna Fáil | 8 | - | 10,369 | 38.54 | ||
| Fine Gael | 6 | -1 | 7,018 | 26.09 | ||
| Sinn Féin | 6 | +4 | 6,709 | 24.94 | ||
| Independent | 0 | -3 | 1,915 | 7.12 | ||
| Totals | 20 | - | 26,901 | 100% | — | |
Results by local electoral area
Carrickmacross
| Party | Candidate | FPv% | Count | ||||
|---|---|---|---|---|---|---|---|
| 1 | 2 | 3 | 4 | ||||
| Fianna Fáil | Pádraig McNally* | 25.33 | 1,642 | ||||
| Sinn Féin | Noel Keelan | 16.09 | 1,043 | 1,096 | |||
| Fianna Fáil | Shane O'Hanlon | 13.90 | 901 | 1,090 | |||
| Fine Gael | Helen Duffy | 12.17 | 789 | 830 | 903 | 945 | |
| Fianna Fáil | Rosaleen O'Hanlon* | 12.02 | 779 | 943 | 1,274 | ||
| Fine Gael | Aidan Murray | 11.48 | 744 | 778 | 918 | 981 | |
| Fianna Fáil | Tom Freeman | 9.01 | 584 | 664 | |||
| Electorate: 10,045 Valid: 6,482 (71.42%) Spoilt: 137 Quota: 1,081 Turnout: 6,619 (73.17%) | |||||||
Castleblayney
| Party | Candidate | FPv% | Count | ||||||
|---|---|---|---|---|---|---|---|---|---|
| 1 | 2 | 3 | 4 | 5 | 6 | ||||
| Fianna Fáil | Senator Francis O'Brien* | 20.67 | 1,361 | ||||||
| Fine Gael | Gary Carville | 16.07 | 1,058 | 1,082 | 1,176 | ||||
| Sinn Féin | Jackie Crowe | 16.00 | 1,053 | 1,075 | 1,137 | ||||
| Fine Gael | Owen Bannigan | 13.06 | 860 | 926 | 967 | 990 | 1,393 | ||
| Fianna Fáil | Brendan Hughes* | 11.56 | 761 | 806 | 833 | 849 | 915 | 974 | |
| Fine Gael | Adam Armstrong | 9.14 | 602 | 609 | 643 | 657 | |||
| Fianna Fáil | Olivia Keenan* | 8.52 | 561 | 653 | 692 | 717 | 756 | 797 | |
| Green | Liam Murtagh | 4.97 | 327 | 334 | |||||
| Electorate: 9,905 Valid: 6,583 (66.46%) Spoilt: 109 Quota: 1,098 Turnout: 6,692 (67.56%) | |||||||||
Clones
| Party | Candidate | FPv% | Count | ||||
|---|---|---|---|---|---|---|---|
| 1 | 2 | 3 | 4 | ||||
| Fine Gael | Hugh McElvaney* | 19.61 | 1,103 | 1,129 | |||
| Fianna Fáil | Senator Ann Leonard | 16.85 | 948 | 1,016 | 1,452 | ||
| Fine Gael | Seymour Crawford TD* | 16.59 | 933 | 946 | 1,018 | 1,113 | |
| Independent | Walter Pringle* | 14.10 | 793 | 815 | 864 | 916 | |
| Fianna Fáil | Benny Kieran | 11.80 | 664 | 721 | |||
| Sinn Féin | Brian MacUaid | 11.52 | 648 | 957 | 1,033 | 1,103 | |
| Sinn Féin | Sheila McKenna | 9.53 | 536 | ||||
| Electorate: 8,271 Valid: 5,625 (68.01%) Spoilt: 95 Quota: 1,126 Turnout: 5,720 (69.16%) | |||||||
Monaghan
| Party | Candidate | FPv% | Count | ||||||||||
|---|---|---|---|---|---|---|---|---|---|---|---|---|---|
| 1 | 2 | 3 | 4 | 5 | 6 | 7 | 8 | 9 | 10 | ||||
| Sinn Féin | Caoimhghin O CaolainTD* | 22.30 | 1,831 | ||||||||||
| Fianna Fáil | Patsy Treanor* | 11.52 | 946 | 1,011 | 1,021 | 1,040 | 1,076 | 1,130 | 1,189 | ||||
| Sinn Féin | Brian McKenna* | 11.24 | 923 | 1,132 | 1,141 | 1,150 | 1,175 | ||||||
| Independent | Noel Maxwell* | 8.77 | 720 | 731 | 753 | 764 | 801 | 829 | 869 | 915 | 924 | 929 | |
| Fianna Fáil | Willie McKenna* | 8.35 | 686 | 720 | 733 | 749 | 768 | 836 | 884 | 1,162 | 1,185 | ||
| Sinn Féin | Brenda McAnespie | 8.22 | 675 | 908 | 920 | 948 | 965 | 1,061 | 1,084 | 1,220 | |||
| Fianna Fáil | Vincent McQuaid | 6.53 | 536 | 557 | 564 | 575 | 605 | 680 | 708 | ||||
| Fine Gael | Pat McKenna | 5.99 | 492 | 500 | 513 | 528 | 558 | 587 | 867 | 927 | 941 | 951 | |
| Fine Gael | Tommy Myles | 7.66 | 437 | 456 | 467 | 490 | 507 | 558 | |||||
| Independent | Plunkett McKenna | 4.90 | 402 | 420 | 433 | 457 | 484 | ||||||
| Christian Solidarity | Gene Flood | 2.69 | 221 | 231 | 247 | 260 | |||||||
| Labour | Ursula Dinkin | 2.14 | 176 | 197 | 226 | ||||||||
| Green | Denis Higgins | 2.02 | 166 | 174 | |||||||||
| Electorate: 13,572 Valid: 8,211 (60.50%) Spoilt: 145 Quota: 1,174 Turnout: 8,356 (61.57%) | |||||||||||||
External links
This article is issued from Wikipedia. The text is licensed under Creative Commons - Attribution - Sharealike. Additional terms may apply for the media files.