2005 Virginia House of Delegates election
The Virginia House of Delegates election of 2005 was held on Tuesday, November 8.
| |||||||||||||||||||||||||||||||||||||
All 100 seats in the Virginia House of Delegates 51 seats needed for a majority | |||||||||||||||||||||||||||||||||||||
|---|---|---|---|---|---|---|---|---|---|---|---|---|---|---|---|---|---|---|---|---|---|---|---|---|---|---|---|---|---|---|---|---|---|---|---|---|---|
| Turnout | 45.0%[1] | ||||||||||||||||||||||||||||||||||||
| |||||||||||||||||||||||||||||||||||||
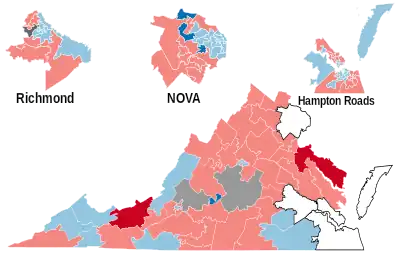
 Results: Republican hold Republican gain Democratic hold Democratic gain Independent hold Independent gain | |||||||||||||||||||||||||||||||||||||
| |||||||||||||||||||||||||||||||||||||
| Elections in Virginia |
|---|
 |
Results
Overview
| 57 | 40 | 3 |
| Republican | Democratic |
| Parties | Candidates | Seats | Popular Vote | ||||||
|---|---|---|---|---|---|---|---|---|---|
| 2003 | 2005 | +/- | Strength | Vote | % | Change | |||
| Republican | 61 | 57 | 58.00% | 979,209 | 56.11% | ||||
| Democratic | 37 | 40 | 39.00% | 640,958 | 36.73% | ||||
| Independent | 2 | 3 | 3.00% | 83,908 | 4.81% | ||||
| Libertarian | 0 | 0 | 0.00% | 11,302 | 0.65% | ||||
| Independent Greens | 0 | 0 | 0.00% | 1,664 | 0.10% | ||||
| - | Write-ins | 0 | 0 | 0.00% | 28,031 | 1.61% | |||
| Total | 100 | 100 | 0 | 100.00% | 1,745,072 | 100.00% | - | ||
See also
References
- "Registration/Turnout Statistics". Virginia Department of Elections. Archived from the original on October 18, 2018. Retrieved January 1, 2018.
- "Election Results - Virginia Department of Elections".
This article is issued from Wikipedia. The text is licensed under Creative Commons - Attribution - Sharealike. Additional terms may apply for the media files.

