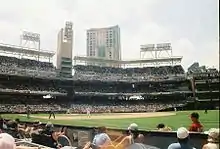
2007 San Diego Padres season
The 2007 San Diego Padres season was the 39th season in franchise history. It began with the Padres' attempt to win a third consecutive NL West title. After finishing the regular season with 89 wins and 73 losses, they were in a tie with the Colorado Rockies for both the NL wild card and second place in the NL West, they were defeated in a tie-breaker which placed them third overall in the division and out of playoff competition.
| 2007 San Diego Padres | |
|---|---|
| Major League affiliations | |
| |
| Location | |
| |
| Results | |
| Record | 89–74 (.546) |
| Divisional place | 3rd |
| Other information | |
| Owners | John Moores |
| General managers | Kevin Towers |
| Managers | Bud Black |
| Local television | 4SD Matt Vasgersian, Mark Grant, Tony Gwynn Cablemas (Spanish) |
| Local radio | XX Sports Radio Ted Leitner, Jerry Coleman, Andy Masur XEMO-AM (Spanish) |
| < Previous season Next season > | |
_Commanding_Officer%252C_Capt._Terry_B._Kraft%252C_throws_out_the_ceremonial_first_pitch_prior_to_a_San_Diego_Padres_baseball_game_honoring_the_ship.jpg.webp)
Offseason
- November 8, 2006: Kevin Kouzmanoff was traded by the Cleveland Indians with Andrew Brown to the San Diego Padres for Josh Barfield.[1]
- December 20, 2006: Marcus Giles was signed as a free agent with the San Diego Padres.[2]
- January 3, 2007: Pete LaForest was signed as a free agent with the San Diego Padres.[3]
Regular season
National League West
| NL West | W | L | Pct. | GB | Home | Road |
|---|---|---|---|---|---|---|
| Arizona Diamondbacks | 90 | 72 | 0.556 | — | 50–31 | 40–41 |
| Colorado Rockies | 90 | 73 | 0.552 | ½ | 51–31 | 39–42 |
| San Diego Padres | 89 | 74 | 0.546 | 1½ | 47–34 | 42–40 |
| Los Angeles Dodgers | 82 | 80 | 0.506 | 8 | 43–38 | 39–42 |
| San Francisco Giants | 71 | 91 | 0.438 | 19 | 39–42 | 32–49 |
Record vs. opponents
Source: | |||||||||||||||||
|---|---|---|---|---|---|---|---|---|---|---|---|---|---|---|---|---|---|
| Team | ARI | ATL | CHC | CIN | COL | FLA | HOU | LAD | MIL | NYM | PHI | PIT | SD | SF | STL | WSH | AL |
| Arizona | — | 4–2 | 4–2 | 2–4 | 8–10 | 6–1 | 5–2 | 8–10 | 2–5 | 3–4 | 5–1 | 5–4 | 10–8 | 10–8 | 4–3 | 6–1 | 8–7 |
| Atlanta | 2–4 | — | 5–4 | 1–6 | 4–2 | 10–8 | 3–3 | 4–3 | 5–2 | 9–9 | 9–9 | 5–1 | 5–2 | 4–3 | 3–4 | 11–7 | 4–11 |
| Chicago | 2–4 | 4–5 | — | 9–9 | 5–2 | 0–6 | 8–7 | 2–5 | 9–6 | 2–5 | 3–4 | 8–7 | 3–5 | 5–2 | 11–5 | 6–1 | 8–4 |
| Cincinnati | 4–2 | 6–1 | 9–9 | — | 2–4 | 4–3 | 4–11 | 2–4 | 8–7 | 2–5 | 2–4 | 9–7 | 2–4 | 4–3 | 6–9 | 1–6 | 7-11 |
| Colorado | 10–8 | 2–4 | 2–5 | 4–2 | — | 3–3 | 3–4 | 12–6 | 4–2 | 4–2 | 4–3 | 4–3 | 11–8 | 10–8 | 3–4 | 4–3 | 10–8 |
| Florida | 1–6 | 8–10 | 6–0 | 3–4 | 3–3 | — | 2–3 | 4–3 | 2–5 | 7–11 | 9–9 | 3–4 | 3–4 | 1–6 | 2–4 | 8–10 | 9–9 |
| Houston | 2–5 | 3–3 | 7–8 | 11–4 | 4–3 | 3-2 | — | 4–3 | 5–13 | 2–5 | 3–3 | 5–10 | 4–3 | 2–4 | 7–9 | 2–5 | 9–9 |
| Los Angeles | 10–8 | 3–4 | 5–2 | 4–2 | 6–12 | 3–4 | 3–4 | — | 3–3 | 5–5 | 4–2 | 5–2 | 8–10 | 10–8 | 3–3 | 5–1 | 5–10 |
| Milwaukee | 5–2 | 2–5 | 6–9 | 7–8 | 2–4 | 5–2 | 13–5 | 3–3 | — | 2–4 | 3–4 | 10–6 | 2–5 | 4–5 | 7–8 | 4–2 | 8–7 |
| New York | 4–3 | 9–9 | 5–2 | 5–2 | 2–4 | 11–7 | 5–2 | 5–5 | 4–2 | — | 6–12 | 4–2 | 2–4 | 4–2 | 5–2 | 9–9 | 8–7 |
| Philadelphia | 1-5 | 9–9 | 4–3 | 4–2 | 3–4 | 9–9 | 3–3 | 2–4 | 4–3 | 12–6 | — | 4–2 | 4–3 | 4–4 | 6–3 | 12–6 | 8–7 |
| Pittsburgh | 4–5 | 1–5 | 7–8 | 7–9 | 3–4 | 4–3 | 10–5 | 2–5 | 6–10 | 2–4 | 2–4 | — | 1–6 | 4–2 | 6–12 | 4–2 | 5–10 |
| San Diego | 8–10 | 2–5 | 5–3 | 4–2 | 8–11 | 4–3 | 3–4 | 10–8 | 5–2 | 4–2 | 3–4 | 6–1 | — | 14–4 | 3–4 | 4–2 | 6–9 |
| San Francisco | 8–10 | 3–4 | 2–5 | 3–4 | 8–10 | 6–1 | 4–2 | 8–10 | 5–4 | 2–4 | 4–4 | 2–4 | 4–14 | — | 4–1 | 3–4 | 5–10 |
| St. Louis | 3–4 | 4–3 | 5–11 | 9–6 | 4–3 | 4-2 | 9–7 | 3–3 | 8–7 | 2–5 | 3–6 | 12–6 | 4–3 | 1–4 | — | 1–5 | 6–9 |
| Washington | 1–6 | 7–11 | 1–6 | 6–1 | 3–4 | 10-8 | 5–2 | 1–5 | 2–4 | 9–9 | 6–12 | 2–4 | 2–4 | 4–3 | 5–1 | — | 9–9 |
Roster
Player stats
Note: Team batting and pitching leaders are in bold.
Starters by position
Note: Pos = Position; G = Games played; AB = At bats; H = Hits; Avg. = Batting average; HR = Home runs; RBI = Runs batted in
| Pos | Player | G | AB | H | Avg. | HR | RBI |
|---|---|---|---|---|---|---|---|
| C | Josh Bard | 118 | 389 | 111 | .285 | 5 | 51 |
| 1B | Adrián González | 161 | 646 | 182 | .282 | 30 | 100 |
| 2B | Marcus Giles | 116 | 420 | 96 | .229 | 4 | 39 |
| SS | Khalil Greene | 153 | 611 | 155 | .254 | 27 | 97 |
| 3B | Kevin Kouzmanoff | 145 | 484 | 133 | .275 | 18 | 74 |
| LF | Termel Sledge | 100 | 200 | 42 | .210 | 7 | 23 |
| CF | Mike Cameron | 151 | 571 | 138 | .242 | 21 | 78 |
| RF | Brian Giles | 121 | 483 | 131 | .271 | 13 | 51 |
Other batters
Note: G = Games played; AB = At bats; H = Hits; Avg. = Batting average; HR = Home runs; RBI = Runs batted in
| Player | G | AB | H | Avg. | HR | RBI |
|---|---|---|---|---|---|---|
| Geoff Blum | 122 | 330 | 83 | .252 | 5 | 33 |
| José Cruz Jr. | 91 | 256 | 60 | .234 | 6 | 21 |
| Milton Bradley | 42 | 144 | 45 | .313 | 11 | 30 |
| Michael Barrett | 44 | 133 | 30 | .226 | 0 | 12 |
| Russell Branyan | 61 | 122 | 24 | .197 | 7 | 19 |
| Scott Hairston | 31 | 87 | 25 | .287 | 8 | 20 |
| Rob Bowen | 30 | 82 | 22 | .268 | 2 | 11 |
| Hiram Bocachica | 27 | 63 | 15 | .238 | 1 | 2 |
| Morgan Ensberg | 30 | 58 | 13 | .224 | 4 | 8 |
| Rob Mackowiak | 28 | 56 | 11 | .196 | 0 | 2 |
| Brady Clark | 21 | 49 | 15 | .306 | 0 | 6 |
| Paul McAnulty | 20 | 40 | 8 | .200 | 1 | 5 |
| Oscar Robles | 24 | 26 | 6 | .231 | 0 | 2 |
| Pete LaForest | 10 | 25 | 9 | .360 | 1 | 3 |
| Chase Headley | 8 | 18 | 4 | .222 | 0 | 0 |
| Brian Myrow | 12 | 10 | 1 | .100 | 0 | 1 |
| Craig Stansberry | 11 | 7 | 2 | .286 | 0 | 1 |
| Jason Lane | 3 | 2 | 0 | .000 | 0 | 0 |
| Colt Morton | 1 | 1 | 0 | .000 | 0 | 0 |
| Drew Macias | 1 | 0 | 0 | ---- | 0 | 0 |
Starting pitchers
Note: G = Games pitched; IP = Innings pitched; W = Wins; L = Losses; ERA = Earned run average; SO = Strikeouts
| Player | G | IP | W | L | ERA | SO |
|---|---|---|---|---|---|---|
| Jake Peavy | 34 | 223.1 | 19 | 6 | 2.54 | 240 |
| Greg Maddux | 34 | 198.0 | 14 | 11 | 4.14 | 104 |
| Chris Young | 30 | 173.0 | 9 | 8 | 3.12 | 167 |
| Justin Germano | 26 | 133.1 | 7 | 10 | 4.46 | 78 |
| David Wells | 22 | 118.2 | 5 | 8 | 5.54 | 63 |
| Tim Stauffer | 2 | 7.2 | 0 | 1 | 21.13 | 6 |
Other pitchers
Note: G = Games pitched; IP = Innings pitched; W = Wins; L = Losses; ERA = Earned run average; SO = Strikeouts
| Player | G | IP | W | L | ERA | SO |
|---|---|---|---|---|---|---|
| Clay Hensley | 13 | 50.0 | 2 | 3 | 6.84 | 30 |
| Brett Tomko | 7 | 27.1 | 2 | 1 | 4.61 | 26 |
| Jack Cassel | 6 | 22.2 | 1 | 1 | 3.97 | 11 |
Relief pitchers
Note: G = Games pitched; W = Wins; L = Losses; SV = Saves; ERA = Earned run average; SO = Strikeouts
| Player | G | W | L | SV | ERA | SO |
|---|---|---|---|---|---|---|
| Trevor Hoffman | 61 | 4 | 5 | 42 | 2.98 | 44 |
| Heath Bell | 81 | 6 | 4 | 2 | 2.02 | 102 |
| Cla Meredith | 80 | 5 | 6 | 0 | 3.50 | 59 |
| Doug Brocail | 67 | 5 | 1 | 0 | 3.05 | 43 |
| Kevin Cameron | 48 | 2 | 0 | 0 | 2.79 | 50 |
| Scott Linebrink | 44 | 3 | 3 | 1 | 3.80 | 25 |
| Justin Hampson | 39 | 2 | 3 | 0 | 2.70 | 34 |
| Joe Thatcher | 22 | 2 | 2 | 0 | 1.29 | 16 |
| Royce Ring | 15 | 1 | 0 | 0 | 3.60 | 17 |
| Wil Ledezma | 9 | 0 | 0 | 0 | 6.28 | 16 |
| Mike Thompson | 7 | 0 | 1 | 0 | 6.89 | 5 |
| Aaron Rakers | 1 | 0 | 0 | 0 | 0.00 | 0 |
Wild Card tie-breaker
The Padres ended tied with the Colorado Rockies for both second place in the NL West as well as the National League Wild Card. A tie-breaker was played on October 1, 2007 in Denver to determine which team would continue on to post-season play. The game lasted 13 innings through four hours and 40 minutes. The Rockies won the Wild Card spot with a final score of 9 to 8, and the Padres' season was over.
Transactions
September 4, 2007: Pete LaForest was selected off waivers by the Philadelphia Phillies from the San Diego Padres.[3]
Game log
|
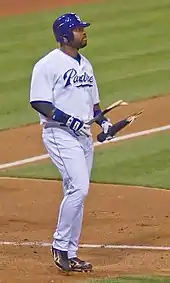
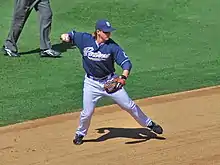
 March 21 spring training game against the Milwaukee Brewers at the Peoria Sports Complex in Arizona. .JPG.webp) Chris Young pitching against the Cubs at Wrigley Field on June 16; he was working on a no-hitter but was later ejected from the game after he and Derrek Lee got into a fight that turned into a bench-clearing altercation.   Milton Bradley on August 28, after striking out and deliberately breaking his bat.  Khalil Greene on September 16, in a game against the Giants.
|
Farm system
LEAGUE CHAMPIONS: San Antonio
References
- Kevin Kouzmanoff Statistics Baseball-Reference.com
- "Marcus Giles Stats".
- "Pete LaForest Statistics and History - Baseball-Reference.com". Archived from the original on January 31, 2010. Retrieved 2010-08-18.