Arizona's 3rd congressional district
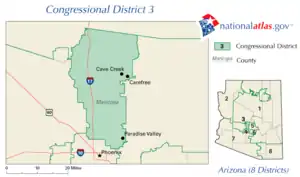
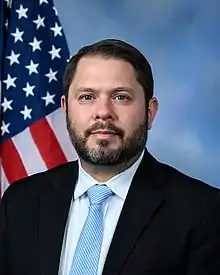
Arizona's 3rd congressional district is a congressional district that includes most of southern, western, and downtown Phoenix, along with a portion of Glendale. It is currently represented by Democrat Ruben Gallego.
| Arizona's 3rd congressional district | |||
|---|---|---|---|
Interactive map of district boundaries since January 3, 2023 | |||
| Representative |
| ||
| Distribution |
| ||
| Population (2022) | 835,089[1] | ||
| Median household income | $63,913[2] | ||
| Ethnicity |
| ||
| Cook PVI | D+24[3] | ||
From 2003 to 2013, most of the district's population was in middle-to-upper class areas in the northern part of Phoenix. Like the metropolitan area in general, the 3rd district leaned Republican, although the southern parts of the district in east-central Phoenix and Paradise Valley were more competitive between the parties. With a Cook Partisan Voting Index rating of D+24, it is the most Democratic district in Arizona.[3]
History
Arizona picked up a third district after the 1960 census. It encompassed the entire northern portion of the state, essentially wrapping around Phoenix and Maricopa County (the 1st district). After a mid-decade redistricting in 1967, the 3rd absorbed a slice of western Maricopa County, including most of what became the West Valley.
Due in part to explosive growth in the Phoenix/Maricopa portion of the district, the 3rd lost much of its eastern portion in the 1970 census. Although it appeared rural on paper, the great majority of its population lived in the West Valley. By the 1970s, as many people lived in the West Valley as in the rest of the district combined.
After the 1990 census, the district was reconfigured to include the Hopi Reservation on the other side of the state. This was a product of longstanding disputes between the Hopi and Navajo. Since tribal boundary disputes are a federal matter, it was long believed inappropriate to include both tribes' reservations in the same congressional district.[4] However, the Hopi reservation is completely surrounded by the Navajo reservation. The final map saw the Hopi reservation connected to the rest of the district by a long, narrow tendril stretching through Coconino County. This was the only way to allow the district to remain contiguous without covering significant portions of Navajo land.
After the 2000 census, this district essentially became the 2nd district, while the 3rd was reconfigured to include much of what had been the 4th district. It now contained most of northern Phoenix as well as some of its northern suburbs. Most of that territory became the 6th district after the 2010 census, while the 3rd was shifted to cover most of what had been the 7th district. This version of the 3rd stretched from western Tucson to Yuma, running along the entire length of the border between Arizona and Mexico. This district, in turn, had mostly been the 2nd district from 1951 to 2003. From 2003 to 2013, most of the district's population was in middle-to-upper-class areas in the northern part of Phoenix. Like the metropolitan area in general, the 3rd district leaned Republican, although the southern parts of the district in east-central Phoenix and Paradise Valley were more competitive between the parties.
George W. Bush received 58% of the vote in this district in 2004. John McCain took in 56.47% of the vote in the district in 2008 while Barack Obama received 42.34%.
After the 2020 census, this district essentially became the 7th district once again, while the 3rd was redrawn to cover much of the former (2013-2022) 7th. It now included much of inner Phoenix, as well as Glendale.[5] Much of this district, in turn, had been the 4th district from 2003 to 2013 and the 7th from 2013 to 2023.
Voting
| Election results from presidential races | ||
|---|---|---|
| Year | Office | Results |
| 2000 | President | Bush 54–43% |
| 2004 | President | Bush 58–41% |
| 2008 | President | McCain 57–42% |
| 2012 | President | Obama 61–38% |
| 2016 | President | Clinton 62–33% |
| 2020 | President | Biden 63–36% |
List of members representing the district
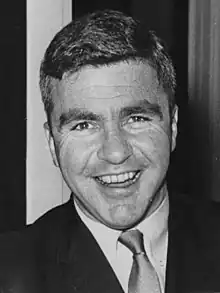
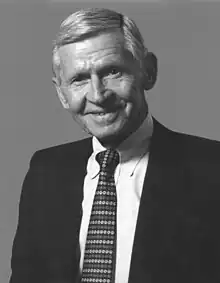
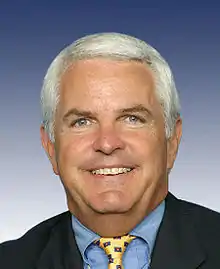
Arizona began sending a third member to the House after the 1960 census.
Recent election results
2002
| Party | Candidate | Votes | % | |
|---|---|---|---|---|
| Republican | John Shadegg | 104,847 | 67.32% | |
| Democratic | Charles Hill | 47,173 | 30.29% | |
| Libertarian | Mark Yannone | 3,731 | 2.40% | |
| Majority | 57,674 | 37.03% | ||
| Total votes | 155,751 | 100.00 | ||
| Republican hold | ||||
2004
| Party | Candidate | Votes | % | |
|---|---|---|---|---|
| Republican | John Shadegg (Incumbent) | 181,012 | 80.10% | |
| Libertarian | Mark Yannone | 44,962 | 19.90% | |
| Majority | 136,050 | 60.20% | ||
| Total votes | 225,974 | 100.00 | ||
| Republican hold | ||||
2006
| Party | Candidate | Votes | % | |
|---|---|---|---|---|
| Republican | John Shadegg (Incumbent) | 112,519 | 59.27% | |
| Democratic | Herb Paine | 72,586 | 38.23% | |
| Libertarian | Mark Yannone | 4,744 | 2.50% | |
| Majority | 39,933 | 21.04% | ||
| Total votes | 189,849 | 100.00 | ||
| Republican hold | ||||
2008
| Party | Candidate | Votes | % | |
|---|---|---|---|---|
| Republican | John Shadegg (Incumbent) | 148,800 | 54.08% | |
| Democratic | Bob Lord | 115,759 | 42.07% | |
| Libertarian | Michael Shoen | 10,602 | 3.85% | |
| Majority | 33,041 | 12.01% | ||
| Total votes | 275,161 | 100.00 | ||
| Republican hold | ||||
2010
| Party | Candidate | Votes | % | |
|---|---|---|---|---|
| Republican | Ben Quayle | 108,689 | 52.24% | |
| Democratic | Jon Hulburd | 85,610 | 41.14% | |
| Libertarian | Michael Shoen | 10,478 | 5.04% | |
| Green | Leonard Clark | 3,294 | 1.58% | |
| Majority | 23,079 | 11.10% | ||
| Total votes | 208,071 | 100.00 | ||
| Republican hold | ||||
2012
| Party | Candidate | Votes | % | |
|---|---|---|---|---|
| Democratic | Raul M. Grijalva (Incumbent) | 98,468 | 58.37% | |
| Republican | Gabriela Saucedo Mercer | 62,663 | 37.15% | |
| Libertarian | Blanca Guerra | 7,567 | 4.49% | |
| Majority | 35,805 | 21.22% | ||
| Total votes | 168,698 | 100.00 | ||
| Democratic hold | ||||
2014
| Party | Candidate | Votes | % | |
|---|---|---|---|---|
| Democratic | Raul M. Grijalva (Incumbent) | 58,192 | 55.7% | |
| Republican | Gabriela Saucedo Mercer | 46,185 | 44.2% | |
| Majority | 12,007 | 11.5% | ||
| Total votes | 104,428 | 100.00 | ||
| Democratic hold | ||||
2016
| Party | Candidate | Votes | % | |
|---|---|---|---|---|
| Democratic | Raul M. Grijalva (Incumbent) | 148,973 | 100% | |
| Total votes | 148,973 | 100 | ||
| Democratic hold | ||||
2018
| Party | Candidate | Votes | % | ±% | |
|---|---|---|---|---|---|
| Democratic | Raul M. Grijalva (Incumbent) | 106,064 | 63.39% | -36.61% | |
| Republican | Nicolas Pierson | 61,267 | 36.61% | +36.61% | |
| Margin of victory | 44,797 | 26.78% | -73.22% | ||
| Total votes | 167,331 | 100.0% | N/A | ||
| Democratic hold | |||||
2020
| Party | Candidate | Votes | % | |
|---|---|---|---|---|
| Democratic | Raúl Grijalva (incumbent) | 174,243 | 64.6 | |
| Republican | Daniel Wood | 95,594 | 35.4 | |
| Total votes | 269,837 | 100.0 | ||
| Democratic hold | ||||
2022
| Party | Candidate | Votes | % | |
|---|---|---|---|---|
| Democratic | Ruben Gallego (incumbent) | 108,599 | 77.0 | |
| Republican | Jeff Zink | 32,475 | 23.0 | |
| Total votes | 141,074 | 100.0 | ||
| Democratic hold | ||||
References
- General
- Center for New Media & Promotion (CNMP), US Census Bureau. "My Congressional District". www.census.gov.
- Center for New Media & Promotion (CNMP), US Census Bureau. "My Congressional District". www.census.gov.
- "2022 Cook PVI: District Map and List". Cook Political Report. Retrieved January 10, 2023.
- Pitzi, Mary Jo, 2011. Navajos seek tribal-dominated district in Arizona. Arizona Republic, Published September 16, 2011. Retrieved November 3, 2011.
- Arizona Congressional Districts: Approved Official Map Congressional District: 3 (Map). January 18, 2022. Archived from the original on November 14, 2022.
- Martis, Kenneth C., The Historical Atlas of United States Congressional Districts, 1789–1983. New York: Macmillan Publishing, 1982.
- Martis, Kenneth C., The Historical Atlas of Political Parties in the United States Congress, 1789–1989. New York: Macmillan Publishing, 1989.
- Congressional Directory: Browse 105th Congress Archived February 17, 2011, at the Wayback Machine
- "2018 General Election". Arizona Secretary of State. November 15, 2018.
- Specific
External links
- Maps of Congressional Districts first in effect for the 2002 election
- Tentative Final Congressional Maps for the 2012 election
- Rose Institute of State and Local Government, "Arizona: 2010 Redistricting Changes: Third District", Redistricting by State, Claremont, CA: Claremont McKenna College, archived from the original on September 15, 2020
.svg.png.webp)


.jpg.webp)
.tif.png.webp)
.svg.png.webp)