Arizona's 7th congressional district
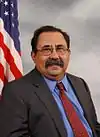
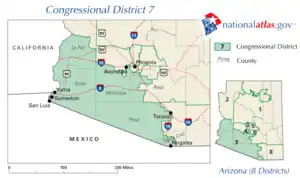
Arizona's 7th congressional district is a congressional district located in the U.S. state of Arizona. The district stretches along the Mexico–United States border and includes the western third of Tucson, parts of Yuma and Nogales, as well as Avondale and Tolleson in Metro Phoenix. It is currently represented by Democrat Raúl Grijalva.
| Arizona's 7th congressional district | |||
|---|---|---|---|
Interactive map of district boundaries since January 3, 2023 | |||
| Representative |
| ||
| Area | 199.23 sq mi (516.0 km2) | ||
| Distribution |
| ||
| Population (2022) | 815,141[1] | ||
| Median household income | $52,555[2] | ||
| Ethnicity |
| ||
| Cook PVI | D+15[3] | ||
History
2003–2013
Arizona picked up a seventh district after the 2000 census. Situated in the southwestern part of the state, it included all of Yuma County and parts of La Paz, Maricopa, Pima, Pinal, and Santa Cruz counties. For all intents and purposes, it was the successor to what had been the 2nd district—the former seat of longtime congressman Mo Udall–from 1951 to 2003.
The district was larger than Rhode Island, Delaware, Hawaii, Connecticut and New Jersey combined.[4] It included 300 miles of the U.S. border with Mexico. It was home to seven sovereign Native American nations: the Ak-Chin Indian Community, Cocopah, Colorado River Indian Tribes, Gila River Indian Community, Pascua Yaqui Tribe, Quechan, and Tohono O'odham.
2013–2023
After the 2010 census, the old 7th district essentially became the 3rd district, while the 7th was redrawn to take in most of the old 4th district.
Voting
| Election results from presidential races | ||
|---|---|---|
| Year | Office | Results |
| 2004 | President | Kerry 57–43% |
| 2008 | President | Obama 57–42% |
| 2012 | President | Obama 72–27% |
| 2016 | President | Clinton 72–23% |
| 2020 | President | Biden 74–25% |
List of members representing the district
Arizona began sending a seventh member to the House after the 2000 Census.
Election results
The district was first created in 2002 following results from the 2000 U.S. Census.
2002
| Party | Candidate | Votes | % | |
|---|---|---|---|---|
| Democratic | Raul M. Grijalva | 61,256 | 59.00% | |
| Republican | Ross Hieb | 38,474 | 37.06% | |
| Libertarian | John L. Nemeth | 4,088 | 3.94% | |
| Majority | 22,782 | 21.94% | ||
| Total votes | 103,818 | 100.00% | ||
| Democratic hold | ||||
2004
| Party | Candidate | Votes | % | |
|---|---|---|---|---|
| Democratic | Raul M. Grijalva (Incumbent) | 108,868 | 62.06% | |
| Republican | Joseph Sweeney | 59,066 | 33.67% | |
| Libertarian | Dave Kaplan | 7,503 | 4.28% | |
| Majority | 49,802 | 28.39% | ||
| Total votes | 175,437 | 100.00% | ||
| Democratic hold | ||||
2006
| Party | Candidate | Votes | % | |
|---|---|---|---|---|
| Democratic | Raul M. Grijalva (Incumbent) | 80,354 | 61.09% | |
| Republican | Ron Drake | 46,498 | 35.35% | |
| Libertarian | Joe Cobb | 4,673 | 3.55% | |
| Majority | 33,856 | 25.74% | ||
| Total votes | 131,525 | 100.00% | ||
| Democratic hold | ||||
2008
| Party | Candidate | Votes | % | |
|---|---|---|---|---|
| Democratic | Raul M. Grijalva (Incumbent) | 124,304 | 63.26% | |
| Republican | Joseph Sweeney | 64,425 | 32.79% | |
| Libertarian | Raymond Patrick Petrulsky | 7,755 | 3.95% | |
| Majority | 59,879 | 30.47% | ||
| Total votes | 196,489 | 100.00% | ||
| Democratic hold | ||||
2010
| Party | Candidate | Votes | % | |
|---|---|---|---|---|
| Democratic | Raul M. Grijalva (Incumbent) | 79,935 | 50.23% | |
| Republican | Ruth McClung | 70,385 | 44.23% | |
| Independent | Harley Meyer | 4,506 | 2.83% | |
| Libertarian | George Keane | 4,318 | 2.71% | |
| Majority | 9,550 | 6.00% | ||
| Total votes | 159,144 | 100.00% | ||
| Democratic hold | ||||
2012
| Party | Candidate | Votes | % | |
|---|---|---|---|---|
| Democratic | Ed Pastor (Incumbent) | 104,489 | 81.74% | |
| Libertarian | Joe Cobb | 23,338 | 18.26% | |
| Majority | 81,151 | 63.48% | ||
| Total votes | 127,827 | 100.00% | ||
| Democratic hold | ||||
2014
| Party | Candidate | Votes | % | |
|---|---|---|---|---|
| Democratic | Ruben Gallego | 54,235 | 74.98% | |
| Libertarian | Joe Cobb | 10,715 | 14.82% | |
| Americans Elect | Rebecca DeWitt | 3,858 | 5.33% | |
| Independent | Jose Peñalosa | 3,496 | 4.83% | |
| Majority | 43,520 | 60.16% | ||
| Total votes | 100.00% | |||
| Democratic hold | ||||
2016
| Party | Candidate | Votes | % | |
|---|---|---|---|---|
| Democratic | Ruben Gallego (incumbent) | 119,465 | 75.22% | |
| Republican | Eve Nunez | 39,286 | 24.74% | |
| Green | Neil B. Westbrooks (Write-in) | 60 | 0.04% | |
| Majority | 80,119 | 50.49% | ||
| Total votes | 158,811 | 100.00% | ||
| Democratic hold | ||||
2018
| Party | Candidate | Votes | % | |
|---|---|---|---|---|
| Democratic | Ruben Gallego (Incumbent) | 113,044 | 85.61% | |
| Green | Gary Swing | 18,706 | 14.17% | |
| Write-in | 301 | 0.22% | ||
| Total votes | 132,051 | 100% | ||
| Democratic hold | ||||
2020
| Party | Candidate | Votes | % | |
|---|---|---|---|---|
| Democratic | Ruben Gallego (Incumbent) | 165,452 | 75.7% | |
| Republican | Josh Barnett | 50,226 | 23.3% | |
| Write-in | 54 | 0.0% | ||
| Total votes | 215,732 | 100% | ||
| Democratic hold | ||||
2022
| Party | Candidate | Votes | % | |
|---|---|---|---|---|
| Democratic | Raúl Grijalva (incumbent) | 126,418 | 64.5% | |
| Republican | Luis Pozzolo | 69,444 | 35.5% | |
| Total votes | 195,862 | 100% | ||
| Democratic hold | ||||
References
- Specific
- Center for New Media & Promotion (CNMP), US Census Bureau. "My Congressional District". www.census.gov.
- Center for New Media & Promotion (CNMP), US Census Bureau. "My Congressional District". www.census.gov.
- "2022 Cook PVI: District Map and List". Cook Political Report. Retrieved January 10, 2023.
- "Congressman Raśl M. Grijalva - Arizona District 7". Archived from the original on January 4, 2007. Retrieved January 3, 2007.
- Martis, Kenneth C., The Historical Atlas of United States Congressional Districts, 1789–1983. New York: Macmillan Publishing, 1982.
- Martis, Kenneth C., The Historical Atlas of Political Parties in the United States Congress, 1789–1989. New York: Macmillan Publishing, 1989.
- Congressional Directory: Browse 105th Congress Archived 2011-02-17 at the Wayback Machine
- "Arizona Secretary of State 2016 Election Information". apps.azsos.gov. Retrieved May 9, 2019.
- General
External links
- Maps of Congressional Districts first in effect for the 2002 election
- Tentative Final Congressional Maps for the 2012 election
- Rose Institute of State and Local Government, "Arizona: 2010 Redistricting Changes: Seventh District", Redistricting by State, Claremont, CA: Claremont McKenna College, archived from the original on September 15, 2020
.svg.png.webp)


.tif.png.webp)
.jpg.webp)
.jpg.webp)
.svg.png.webp)