Ahmedabad district
Ahmedabad district comprises the city of Ahmedabad, in the central part of the state of Gujarat in western India. It is the seventh most populous district in India (out of 739).[1]
Ahmedabad district | |
|---|---|
 .JPG.webp)  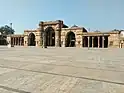  Clockwise from top-left: Sabarmati Ashram, Hutheesing Jain Temple, Jami Masjid, Ahmedabad, birds in Nal Sarovar, Sardar Patel Stadium | |
| Nickname: Karnavati | |
.svg.png.webp) Ahmedabad district location in Gujarat | |
| Coordinates: 23°1′48″N 72°34′48″E | |
| Country | |
| State | Gujarat |
| Metro | Ahmedabad Metro |
| Municipalities | Bareja, Dholka, Viramgam, Bavla, Dhandhuka, Sanand |
| Named for | Karnavati |
| Headquarters | Ahmedabad |
| Taluks | Ahmedabad City, Daskroi, Sanand, Viramgam, Detroj-Rampura, Mandal, Bavla, Dholka, Dhandhuka, Dholera |
| Government | |
| • District Collector | Sandip J. Sagale IAS (BJP) |
| Area | |
| • Total | 8,087 km2 (3,122 sq mi) |
| Population (2011)[1] | |
| • Total | 7,045,313 |
| • Rank | 1 of 33 in Gujarat |
| • Density | 870/km2 (2,300/sq mi) |
| Time zone | UTC+5:30 (IST) |
| PIN | 390xxx |
| Telephone code | 91 04142 |
| Vehicle registration | GJ-1, GJ-27, GJ-38 |
| Largest city | Ahmedabad |
| Nearest city | Ahmedabad city, Ahmedabad |
| Sex ratio | 904 ♂/♀ |
| Literacy | 85.31% |
| Legislature type | elected |
| Vidhan Sabha constituency | Ahmedabad East, Ahmedabad West |
| Avg. summer temperature | 41.5 °C (106.7 °F) |
| Avg. winter temperature | 11.8 °C (53.2 °F) |
| Website | Official website
ahmedabad |
| [2] | |
Etymology
The area around Ahmedabad has been inhabited since the 11th century, when it was known as Ashaval.[3] At that time, Karna, the Chaulukya (Solanki) ruler of Anhilwara (modern Patan), waged a successful war against the Bhil king of Ashaval,[4] and established a city called Karnavati on the banks of the Sabarmati.[5]
In 1411, this area came under the control of Muzaffar Shah I's grandson, Sultan Ahmed Shah, who selected the forested area along the banks of the Sabarmati river for a new capital city. He laid the foundation of a new walled city near Karnavati and named it Ahmedabad after himself.[6][7] According to other versions, he named the city after four Muslim saints in the area who all had the name Ahmedabad.[8]
Data
| S.NO. | [9] | SOURCE | PERIODICITY (and latest available) | DATA | |||||||
| A. | HEALTH | ||||||||||
| Total | Rural | Urban | |||||||||
| A.1 | Sex Ratio (Number of females per 1000 males) | District Census Handbook, Census of India | Decadal (2011) | 904 | 933 | 899 | |||||
| A.2 | Births to women aged 15-19years out of total births (%) | Not available | Not available | Not available | |||||||
| A.3 | Mean number of children ever born to women aged 40-49years (#) | Not available | Not available | Not available | |||||||
| A.4 | Current use of family planning methods (%) | Not available | Not available | Not available | |||||||
| A.5 | Current use of any modern method of family planning (%) | Not available | Not available | Not available | |||||||
| A.6 | Total unmet need for family planning (%) | Not available | Not available | Not available | |||||||
| A.7 | Institutional Deliveries (%) | Not available | Not available | Not available | |||||||
| A.8 | Deliveries at home conducted by skilled health personnel (%) | Not available | Not available | Not available | |||||||
| A.9 | Children who received full vaccination (%) | Not available | Not available | Not available | |||||||
| A.10 | Prevalence of Acute illness (%) | Not available | Not available | Not available | |||||||
| A.11 | Prevalence of Chronic illness (%) | Not available | Not available | Not available | |||||||
| A.12 | Prevalence of Anaemia (6-59months) (%) | Not available | Not available | Not available | |||||||
| A.13 | Prevalence of Severe Anaemia (6-59months) (%) | Not available | Not available | Not available | |||||||
| A.14 | Prevalence of Anaemia in pregnant women aged 15-49years (%) | Not available | Not available | Not available | |||||||
| A.15 | Prevalence of Severe Anaemia in pregnant women aged 15-49years (%) | Not available | Not available | Not available | |||||||
| A.16 | Prevalence of Anaemia in women aged 15-49years (%) | Not available | Not available | Not available | |||||||
| A.17 | Prevalence of Severe Anaemia in women aged 15-49years (%) | Not available | Not available | Not available | |||||||
| A.18 | Mean age at marriage for girls | Not available | Not available | Not available | |||||||
| A.19 | Mean age at marriage for boys | Not available | Not available | Not available | |||||||
| A.20 | Currently married women married below 18years of age (%) | Not available | Not available | Not available | |||||||
| A.21 | Currently married men married below 21years of age (%) | Not available | Not available | Not available | |||||||
| A.22 | Villages with Sub-Health Centres within 3km (%) | Not available | Not applicable | ||||||||
| A.23 | Villages with Primary Health Centre within 10km (%) | Not available | Not applicable | ||||||||
| A.24 | PHCs functioning on a 24x7hours basis (%) | Not available | Not applicable | ||||||||
| A.25 | Number of District Hospitals (#) | Not available | Not applicable | ||||||||
| B. | EDUCATION | ||||||||||
| B.1 | Literacy Rate (%) | District Census Handbook, Census of India | Decadal (2011) | Total | 85.31 | Male | 90.74 | Female | 79.35 | ||
| Primary | Upper Primary | ||||||||||
| B.2 | Gross Enrolment Ratio (%) | DISE | Annual (2013-14) | 102.3 | 86.7 | ||||||
| B.3 | Net Enrolment Ratio (%) | DISE | Annual (2013-14) | 82.2 | 63.8 | ||||||
| B.4 | Drop Out Rate (%) | DISE | Annual (2013-14) | Not available | 1.7 | ||||||
| B.5 | Pupil-Teacher Ratio (%) | DISE | Annual (2013-14) | 35.0 | 35.0 | ||||||
| B.6 | Student-Classroom Ratio (%) | DISE | Annual (2013-14) | 31.0 | 26.0 | ||||||
| B.7 | Girl's Enrolment (%) | DISE | Annual (2013-14) | 50.7 | 48.6 | ||||||
| B.8 | Female Teachers (%) | DISE | Annual (2013-14) | 82.8 | 57.1 | ||||||
| B.9 | New Government Schools since 2003 (%) | DISE | Annual (2013-14) | 13.6 | 11.2 | ||||||
| B.10 | Schools with girls toilet (%) | DISE | Annual (2013-14) | 100.0 | 100.0 | ||||||
| B.11 | Schools with boys toilet (%) | DISE | Annual (2013-14) | 100.3 | 100.0 | ||||||
| B.12 | Schools with drinking water facility (%) | DISE | Annual (2013-14) | 100.0 | 100.0 | ||||||
| B.13 | Schools with electricity (%) | DISE | Annual (2013-14) | 100.0 | 100.0 | ||||||
| C. | ELECTRICITY | ||||||||||
| Total | Rural | Urban | |||||||||
| C.1 | Households with electricity (%) | Not available | Not available | Not available | |||||||
| C.2 | Total Households in District (#) | Houselisting and Housing Census Data Tables- District Level (HH-7), Census of India | Decadal (2011) | 1,494,656 | 228,886 | 1,265,770 | |||||
| % (out of total HH) | # | % (out of total rural HH) | # | % (out of total urban HH) | # | ||||||
| C.3 | Households with electricity as main source of lighting | Houselisting and Housing Census Data Tables- District Level (HH-7), Census of India | Decadal (2011) | 97.42 | 1,456,046 | 92.13 | 210,869 | 98.37 | 1,245,177 | ||
| C.4 | Households with solar energy as main source of lighting | Houselisting and Housing Census Data Tables- District Level (HH-7), Census of India | Decadal (2011) | 0.04 | 624 | 0.10 | 231 | 0.03 | 393 | ||
| C.5 | Households with no lighting | Houselisting and Housing Census Data Tables- District Level (HH-7), Census of India | Decadal (2011) | 0.44 | 6,511 | 0.97 | 2,219 | 0.34 | 4,292 | ||
| D. | WATER | ||||||||||
| Total | Rural | Urban | |||||||||
| D.1 | Households with improved source of drinking water (%) | Not available | Not available | Not available | |||||||
| D.2 | Total Households in District | Houselisting and Housing Census Data Tables- District Level (HH-6), Census of India | Decadal (2011) | 1,494,656 | 228,886 | 1,265,770 | |||||
| % (of total HH) | # | % (of total rural HH) | # | % (of total urban HH) | # | ||||||
| D.3 | Households with main source of drinking water within premises | Houselisting and Housing Census Data Tables- District Level (HH-6), Census of India | Decadal (2011) | 86.07 | 1,286,525 | 59.88 | 137,050 | 90.81 | 1,149,475 | ||
| D.4 | Households receiving treated tap water within premises | Houselisting and Housing Census Data Tables- District Level (HH-6), Census of India | Decadal (2011) | 62.23 | 930,100 | 15.86 | 36,310 | 70.61 | 893,790 | ||
| D.5 | Households receiving untreated tap water within premises | Houselisting and Housing Census Data Tables- District Level (HH-6), Census of India | Decadal (2011) | 14.16 | 211,600 | 39.82 | 91,135 | 9.52 | 120,465 | ||
| E. | TELECOMMUNICATION | ||||||||||
| Total | Rural | Urban | |||||||||
| E.1 | Households with landline phone (%) | District Census Handbook, Census of India | Decadal (2011) | 5.17 | 2.40 | 5.67 | |||||
| E.2 | Households with mobile phone (%) | District Census Handbook, Census of India | Decadal (2011) | 61.79 | 57.01 | 62.66 | |||||
| E.3 | Households with computer/laptop with internet connection (%) | District Census Handbook, Census of India | Decadal (2011) | 8.45 | 0.44 | 9.90 | |||||
Climate
| Climate data for Ahmedabad | |||||||||||||
|---|---|---|---|---|---|---|---|---|---|---|---|---|---|
| Month | Jan | Feb | Mar | Apr | May | Jun | Jul | Aug | Sep | Oct | Nov | Dec | Year |
| Average high °C (°F) | 28.3 (82.9) |
30.4 (86.7) |
35.6 (96.1) |
39.8 (103.6) |
41.5 (106.7) |
38.4 (101.1) |
33.4 (92.1) |
31.8 (89.2) |
34.0 (93.2) |
35.8 (96.4) |
32.8 (91.0) |
29.3 (84.7) |
41.5 (106.7) |
| Average low °C (°F) | 20.1 (68.2) |
13.9 (57.0) |
18.9 (66.0) |
23.7 (74.7) |
26.2 (79.2) |
27.2 (81.0) |
25.6 (78.1) |
24.6 (76.3) |
24.2 (75.6) |
21.1 (70.0) |
16.6 (61.9) |
13.2 (55.8) |
11.8 (53.2) |
| Average rainfall mm (inches) | 2.0 (0.08) |
1.0 (0.04) |
0 (0) |
3.0 (0.12) |
20 (0.8) |
103.0 (4.06) |
247.0 (9.72) |
288.0 (11.34) |
83.0 (3.27) |
23.0 (0.91) |
14.0 (0.55) |
5.0 (0.20) |
789 (31.1) |
| Average rainy days (≥ 0 mm) | 0.3 | 0.3 | 0.1 | 0.3 | 0.9 | 4.8 | 13.6 | 15.0 | 5.8 | 1.1 | 1.1 | 0.3 | 43.6 |
| Mean monthly sunshine hours | 288.3 | 274 | 279 | 307 | 329 | 237.0 | 130 | 111.6 | 222 | 291 | 273 | 288.3 | 3,020 |
| Source: HKO[10] | |||||||||||||
Talukas


Following are the talukas of Ahmedabad district:
Talukas in Ahmedabad City - West
Talukas in Rural North Ahmedabad
Politics
Demographics
| Year | Pop. | ±% p.a. |
|---|---|---|
| 1901 | 681,713 | — |
| 1911 | 717,107 | +0.51% |
| 1921 | 765,900 | +0.66% |
| 1931 | 850,077 | +1.05% |
| 1941 | 1,178,608 | +3.32% |
| 1951 | 1,516,191 | +2.55% |
| 1961 | 2,016,668 | +2.89% |
| 1971 | 2,765,925 | +3.21% |
| 1981 | 3,706,573 | +2.97% |
| 1991 | 4,631,351 | +2.25% |
| 2001 | 5,893,164 | +2.44% |
| 2011 | 7,214,225 | +2.04% |
| source:[12] | ||
According to the 2011 census Ahmedabad district has a population of 7,214,225,[1] roughly equal to Hong Kong[13] or the U.S. state of Washington.[14] This gives it a ranking of 8th in India (out of a total of 640).[1] The district has a population density of 983 inhabitants per square kilometre (2,550/sq mi) .[1] Its population growth rate over the decade 2001-2011 was 22.31%.[1] Ahmedabad has a sex ratio of 903 females for every 1000 males,[1] and a literacy rate of 86.65%.[1]
The divided district has a population of 7,045,313, of which 6,028,152 (85.56%) lived in urban areas. Ahmedabad had a sex ratio of 904 females per 1000 males. Scheduled Castes and Scheduled Tribes make up 747,806 (10.61%) and 88,911 (1.26%) of the population respectively.[1]
Cities and Towns
The population of all cities and towns in the Ahmedabad district by census years.[15]
| Name[lower-alpha 1] | Status | Population
Census 1991-03-01 |
Population
Census 2001-03-01 |
Population
Census 2011-03-01 |
|---|---|---|---|---|
| Ahmadabad | Municipal Corporation with Outgrowth (Metropolis) | 2,876,710 | 3,694,974 | 5,633,927 |
| Ahmadabad Cantonment | Cantonment (Board) | 11,967 | 14,706 | 7,588 |
| Bareja | Municipality | ... | 15,427 | 19,690 |
| Barwala | Municipality | ... | 16,048 | 17,951 |
| Bavla | Municipality with Outgrowth | 25,391 | 30,871 | 42,458 |
| Bopal | Census Town | ... | 12,181 | 37,635 |
| Dhandhuka | Municipality | 27,781 | 29,572 | 32,475 |
| Dholka | Municipality with Outgrowth | 49,860 | 61,569 | 80,945 |
| Nandej | Census Town | 6,878 | 7,642 | 9,176 |
| Ranpur | Census Town | ... | 14,486 | 16,944 |
| Sanand | Municipality with Outgrowth | 25,674 | 32,417 | 95,890 |
| Singarva | Census Town | 8,183 | 9,889 | 12,547 |
| Viramgam | Municipality | 50,788 | 53,094 | 55,821 |
Religion
Hindus are 5,885,869 while Muslims are 871,887, Jains are 208,575 and Christians 50,631.[16]
Notable people
- Acharya Hemachandra (1089–1172) Jain polymath. Born in Dhandhuka.[18]
- Joravarsinh Jadav (born 1940), folklorist
Notes
- Source: Office of the Registrar General and Census Commissioner (web), Delimitation Commission of India (web), Rand McNally International Atlas 1994, School of Planning & Architecture (web)
References
- "District Census Hand Book – Ahmedabad" (PDF). Census of India. Registrar General and Census Commissioner of India.
- "District wise Statistics | NITI Aayog, (National Institution for Transforming India), Government of India". 164.100.94.191. Retrieved 2023-01-05.
- Turner, Jane (1996). The Dictionary of Art. Vol. 1. Grove. p. 471. ISBN 978-1-884446-00-9.
- Michell, George; Snehal Shah; John Burton-Page; Mehta, Dinesh (28 July 2006). Ahmadabad. Marg Publications. pp. 17–19. ISBN 81-85026-03-3.
- Gopal, Madan (1990). K.S. Gautam (ed.). India Through the Ages. Publication Division, Ministry of Information and Broadcasting, Government of India. p. 173.
- More, Anuj (18 October 2010). "Baba Maneknath's kin keep alive 600-yr old tradition". The Indian Express. Archived from the original on 11 April 2013. Retrieved 21 February 2013.
- This ambiguity is similar to the case of Tsar Peter the Great naming his new capital "Saint Petersburg", referring officially to Saint Peter but in fact also to himself.
- "History of Ahmedabad". Ahmedabad Municipal Corporation, egovamc.com. Archived from the original on 23 February 2016. Retrieved 14 May 2012.
- "District wise Statistics | NITI Aayog, (National Institution for Transforming India), Government of India". 164.100.94.191. Retrieved 2023-01-05.
- "Ahmedabad Climate Record". Archived from the original on 15 August 2019. Retrieved 1 May 2012.
- "Bhupendra Patel named Gujarat CM again". news.abplive.com. Retrieved 2022-12-10.
- Decadal Variation In Population Since 1901
- US Directorate of Intelligence. "Country Comparison:Population". Archived from the original on June 13, 2007. Retrieved 2011-10-01.
Hong Kong 7,122,508 July 2011 est.
- "2010 Resident Population Data". U. S. Census Bureau. Archived from the original on 2010-12-25. Retrieved 2011-09-30.
Washington 6,724,540
- "Gujarat (India): Districts, Cities and Towns - Population Statistics, Charts and Map". citypopulation.de. Retrieved 2023-03-17.
- "Population by Religion - Gujarat". censusindia.gov.in. Registrar General and Census Commissioner of India. 2011.
- "Table C-16 Population by Mother Tongue: Gujarat". censusindia.gov.in. Registrar General and Census Commissioner of India.
- "Hemacandra". Jain World. Archived from the original on April 29, 2008. Retrieved 2008-05-06.
External links
- Official website

- Ahmedabad RTO
 Geographic data related to Ahmedabad district at OpenStreetMap
Headquarters: Ahmedabad | |||||||||
| History | | ||||||||
| Geography |
| ||||||||
| Talukas (Headquarters) | |||||||||
| Lok Sabha constituencies | |||||||||
Places adjacent to Ahmedabad district | |
|---|---|
| Topics | 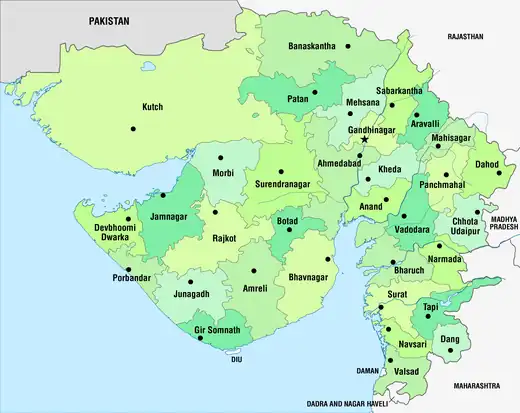 | |
|---|---|---|
| Regions of Gujarat | ||
| Districts | ||
| Major cities | ||
| Ecoregions | ||
| Economy |
| |