Amplitude versus offset
In geophysics and reflection seismology, amplitude versus offset (AVO) or amplitude variation with offset is the general term for referring to the dependency of the seismic attribute, amplitude, with the distance between the source and receiver (the offset). AVO analysis is a technique that geophysicists can execute on seismic data to determine a rock's fluid content, porosity, density or seismic velocity, shear wave information, fluid indicators (hydrocarbon indications).[1]
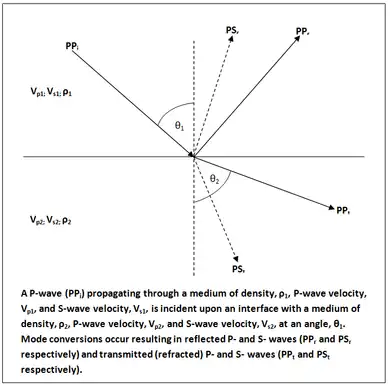
The phenomenon is based on the relationship between the reflection coefficient and the angle of incidence and has been understood since the early 20th century when Karl Zoeppritz wrote down the Zoeppritz equations. Due to its physical origin, AVO can also be known as amplitude versus angle (AVA), but AVO is the more commonly used term because the offset is what a geophysicist can vary in order to change the angle of incidence. (See diagram)

Background and theory

For a seismic wave reflecting off an interface between two media at normal incidence, the expression for the reflection coefficient is relatively simple:
- ,
where and are the acoustic impedances of the first and second medium, respectively.
The situation becomes much more complicated in the case of non-normal incidence, due to mode conversion between P-waves and S-waves, and is described by the Zoeppritz equations.
Zoeppritz equations
In 1919, Karl Bernhard Zoeppritz derived four equations that determine the amplitudes of reflected and refracted waves at a planar interface for an incident P-wave as a function of the angle of incidence and six independent elastic parameters.[2] These equations have 4 unknowns and can be solved but they do not give an intuitive understanding for how the reflection amplitudes vary with the rock properties involved.[3]
Richards and Frasier (1976), Aki and Richards (1980)
P. Richards and C. Frasier[4] expanded the terms for the reflection and transmission coefficients for a P-wave incident upon a solid-solid interface and simplified the result by assuming only small changes in elastic properties across the interface. Therefore, the squares and differential products are small enough to tend to zero and be removed. This form of the equations allows one to see the effects of density and P- or S- wave velocity variations on the reflection amplitudes. This approximation was popularized in the 1980 book Quantitative Seismology by K. Aki and P. Richards and has since been commonly referred to as the Aki and Richards approximation.[5]
Ostrander (1980)
Ostrander was the first to introduce a practical application of the AVO effect, showing that a gas sand underlying a shale exhibited amplitude variation with offset.[6]
Shuey (1985)
Shuey further modified the equations by assuming – as Ostrander had – that Poisson's ratio was the elastic property most directly related to the angular dependence of the reflection coefficient.[3] This gives the 3-term Shuey Equation:[7]
where
and
- ;
where =angle of incidence; = P-wave velocity in medium; = P-wave velocity contrast across interface; = S-wave velocity in medium; = S-wave velocity contrast across interface; = density in medium; = density contrast across interface;
In the Shuey equation, R(0) is the reflection coefficient at normal incidence and is controlled by the contrast in acoustic impedances. G, often referred to as the AVO gradient, describes the variation of reflection amplitudes at intermediate offsets and the third term, F, describes the behaviour at large angles/far offsets that are close to the critical angle. This equation can be further simplified by assuming that the angle of incidence is less than 30 degrees (i.e. the offset is relatively small), so the third term will tend to zero. This is the case in most seismic surveys and gives the "Shuey Approximation":
This was the final development needed before AVO analysis could become a commercial tool for the oil industry.[7]
Use

Modern seismic reflection surveys are designed and acquired in such a way that the same point on the subsurface is sampled multiple times, with each sample having a different source and receiver location. The seismic data is then carefully processed to preserve seismic amplitudes and accurately determine the spatial coordinates of each sample. This allows a geophysicist to construct a group of traces with a range of offsets that all sample the same subsurface location in order to perform AVO analysis. This is known as a Common Midpoint Gather[8] (a midpoint being the area of the subsurface that a seismic wave reflects off before returning to the receiver) and in a typical seismic reflection processing workflow, the average amplitude would be calculated along the time sample, in a process known as "stacking". This process significantly reduces random noise but loses all information that could be used for AVO analysis.[9]
AVO crossplots
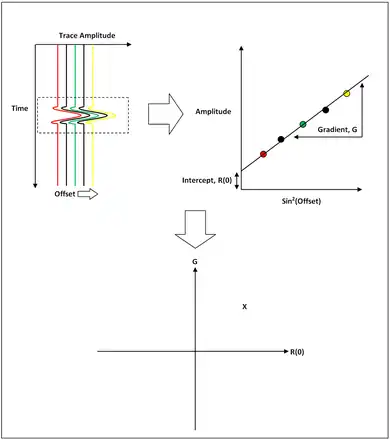
A CMP gather is constructed, the traces are conditioned so that they reference the same two-way travel time, sorted in order of increasing offset and the amplitude of each trace at a specific time horizon is extracted. Remembering the 2-term Shuey Approximation, the amplitude of each trace is plotted against sin^2 of its offset and the relationship becomes linear, as seen in the diagram. Using linear regression, a line of best fit can now be calculated that describes how the reflection amplitude varies with offset using just 2 parameters: the intersect, P, and the gradient, G.
As per the Shuey approximation, the intersect P corresponds to R(0), the reflection amplitude at zero-offset, and the gradient G describes the behaviour at non-normal offset, a value known as the AVO gradient. Plotting P (or R(0)) against G for every time sample in every CMP gather produces an AVO crossplot and can be interpreted in a number of ways.
Interpretation
An AVO anomaly is most commonly expressed as increasing (rising) AVO in a sedimentary section, often where the hydrocarbon reservoir is "softer" (lower acoustic impedance) than the surrounding shales. Typically amplitude decreases (falls) with offset due to geometrical spreading, attenuation and other factors. An AVO anomaly can also include examples where amplitude with offset falls at a lower rate than the surrounding reflective events.
Applications in the oil and gas industry
The most important application of AVO is the detection of hydrocarbon reservoirs. Increasing AVO is usually present in oil-bearing sediments with at least 10% gas saturation, but is especially pronounced in porous, low-density gas-bearing sediments with little to no oil. Particularly important examples are those seen in Middle Tertiary gas sands of the coastal counties of Southeast Texas, turbidite sands such as the Late Tertiary deltaic sediments in the Gulf of Mexico (especially during the 1980s–1990s), West Africa, and other major deltas around the world. Most major companies use AVO routinely as a tool to "de-risk" exploration targets and to better define the extent and the composition of existing hydrocarbon reservoirs.
AVO is not fail-safe
An important caveat is that the existence of abnormally rising or falling amplitudes can sometimes be caused by other factors, such as alternative lithologies and residual hydrocarbons in a breached gas column. Not all oil and gas fields are associated with an obvious AVO anomaly (e.g. most of the oil found in the Gulf of Mexico in the last decade), and AVO analysis is by no means a panacea for gas and oil exploration.
References
- http://www.glossary.oilfield.slb.com/Display.cfm?Term=amplitude%20variation%20with%20offset Schlumberger Oilfield Glossary
- Sheriff, R. E., Geldart, L. P., (1995), 2nd Edition. Exploration Seismology. Cambridge University Press.
- Shuey, R. T. [1985] A simplification of the Zoeppritz equations. Geophysics, 50:609–614
- Richards, P. G., and Frasier, C. W., 1976, Scattering of elastic wave from depth-dependent inhomogeneities: Geophysics, 41, 441–458
- Aki, K. and Richards, P. G., 1980, Quantitative seismology: Theory and methods, v.1 : W.H. Freeman and Co.
- Ostrander, W.J., 1984, Plane wave reflection coefficients for gas sands at non-normal angles of incidence: Geophysics, 49, 1637–1648.
- Avseth, P, T Mukerji and G Mavko (2005). Quantitative seismic interpretation. Cambridge University Press, Cambridge, UK
- http://www.glossary.oilfield.slb.com/Display.cfm?Term=CMP Schlumberger Oilfield Glossary
- Young, R. & LoPiccolo, R. 2005. AVO analysis demystified. E&P. https://e-seis.com/wp-content/uploads/2014/11/AVO-Analysis-Demystified.pdf