Cross-plot
A cross-plot is a scatter plot used primarily in Earth science and social science[1] to describe a specialized chart that compares multiple measurements made at a single time or location along two or more axes. The axes of the plot are commonly linear, but may also be logarithmic.[2]
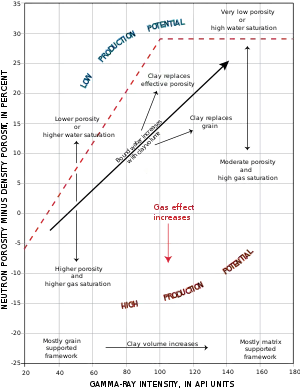
Example of a cross-plot used in petroleum geology for the interpretation of water saturation and clay content using well log data
Cross-plots are used to interpret geophysical (e.g., amplitude versus offset analysis), geochemical, and hydrologic data.
References
- Gorard, Stephen (February 2015). "Rethinking 'quantitative' methods and the development of new researchers". Review of Education. 3 (1): 72–96. doi:10.1002/rev3.3041. ISSN 2049-6613.
- "crossplot". Energy Glossary. Retrieved 2023-01-27.
This article is issued from Wikipedia. The text is licensed under Creative Commons - Attribution - Sharealike. Additional terms may apply for the media files.