Barnwell County, South Carolina
Barnwell County is a county in the U.S. state of South Carolina. As of the 2020 census, its population was 20,589.[1] Barnwell County is part of the Augusta-Richmond County, GA-SC Metropolitan Statistical Area. It is located in the Central Savannah River Area. Its county seat is Barnwell.[2]
Barnwell County | |
|---|---|
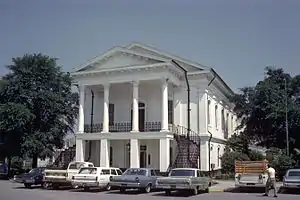 Barnwell County Courthouse | |
 Seal Logo | |
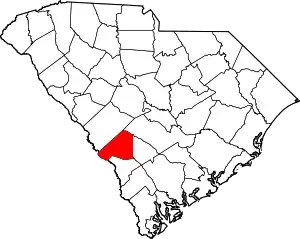 Location within the U.S. state of South Carolina | |
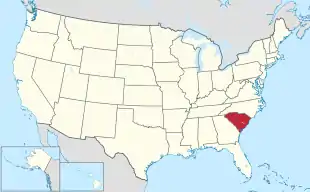 South Carolina's location within the U.S. | |
| Coordinates: 33°16′N 81°26′W | |
| Country | |
| State | |
| Founded | 1800 |
| Named for | John Barnwell |
| Seat | Barnwell |
| Largest community | Barnwell |
| Area | |
| • Total | 557.26 sq mi (1,443.3 km2) |
| • Land | 548.38 sq mi (1,420.3 km2) |
| • Water | 8.88 sq mi (23.0 km2) 1.59% |
| Population (2020) | |
| • Total | 20,589 |
| • Estimate (2022) | 20,414 |
| • Density | 37.55/sq mi (14.50/km2) |
| Time zone | UTC−5 (Eastern) |
| • Summer (DST) | UTC−4 (EDT) |
| Congressional district | 2nd |
| Website | sc-barnwell |
History
The Barnwell District was created in 1797 (effective in 1800) from the southwestern portion of the Orangeburg District, along the Savannah River.[3] It was named after John Barnwell, a local figure in the Revolutionary War.[4]
In 1868, under the South Carolina Constitution revised during Reconstruction, South Carolina districts became counties. The government was made more democratic, with county officials to be elected by male citizens at least 21 years old,[5] rather than by the state legislature as done previously.
In 1871 the legislature took the northwestern portion of the county to form part of the new Aiken County, the only county organized during the Reconstruction era. In 1874 the border with Aiken County was adjusted slightly. This county and Barnwell, with populations of blacks and whites that were nearly equal, had extensive violence in the months before the 1874 and 1876 elections, as groups of paramilitary Red Shirts rode to disrupt black Republican meetings and intimidate voters to suppress black voting. More than 100 black men were killed in Aiken County during the violence, especially at Ellenton, South Carolina.
In 1895 white Democrats in the state legislature passed a new constitution, disfranchising most blacks for more than 60 years by raising barriers to voter registration.
In 1897 the eastern third of the county was taken to form the new Bamberg County. In 1919 most of the southern half of the county was taken to form most of the new Allendale County, thus reducing Barnwell county to its present size.
Geography
According to the U.S. Census Bureau, the county has a total area of 557.26 square miles (1,443.3 km2), of which 548.38 square miles (1,420.3 km2) is land and 8.88 square miles (23.0 km2) (1.59%) is water.[6]
State and local protected areas/sites
- Banksia Hall
- Barnwell State Park
- Long Branch Bay Heritage Preserve[7]
Major water bodies
- Georges Creek[8]
- Parr Pond[9]
- Pond B[10]
- Salkehatchie River
- Savannah River
- South Fork Edisto River
Adjacent counties
- Aiken County – north
- Bamberg County – east
- Orangeburg County – east
- Allendale County – southeast
- Burke County, Georgia – southwest
Major infrastructure
Demographics
| Census | Pop. | Note | %± |
|---|---|---|---|
| 1800 | 7,376 | — | |
| 1810 | 12,280 | 66.5% | |
| 1820 | 14,750 | 20.1% | |
| 1830 | 19,236 | 30.4% | |
| 1840 | 21,471 | 11.6% | |
| 1850 | 26,608 | 23.9% | |
| 1860 | 30,743 | 15.5% | |
| 1870 | 35,724 | 16.2% | |
| 1880 | 39,857 | 11.6% | |
| 1890 | 44,613 | 11.9% | |
| 1900 | 35,504 | −20.4% | |
| 1910 | 34,209 | −3.6% | |
| 1920 | 23,081 | −32.5% | |
| 1930 | 21,221 | −8.1% | |
| 1940 | 20,138 | −5.1% | |
| 1950 | 17,266 | −14.3% | |
| 1960 | 17,659 | 2.3% | |
| 1970 | 17,176 | −2.7% | |
| 1980 | 19,868 | 15.7% | |
| 1990 | 20,293 | 2.1% | |
| 2000 | 23,478 | 15.7% | |
| 2010 | 22,621 | −3.7% | |
| 2020 | 20,589 | −9.0% | |
| 2022 (est.) | 20,414 | [1] | −0.8% |
| U.S. Decennial Census[11] 1790–1960[12] 1900–1990[13] 1990–2000[14] 2010[15] 2020[1] | |||
2020 census
| Race | Num. | Perc. |
|---|---|---|
| White (non-Hispanic) | 10,352 | 50.28% |
| Black or African American (non-Hispanic) | 8,785 | 42.67% |
| Native American | 61 | 0.3% |
| Asian | 161 | 0.78% |
| Pacific Islander | 14 | 0.07% |
| Other/Mixed | 696 | 3.38% |
| Hispanic or Latino | 520 | 2.53% |
As of the 2020 census, there were 20,589 people, 8,360 households, and 5,260 families residing in the county.
2010 census
At the 2010 census, there were 22,621 people, 8,937 households, and 6,055 families living in the county.[17][15] The population density was 41.2 inhabitants per square mile (15.9/km2). There were 10,484 housing units at an average density of 19.1 units per square mile (7.4 units/km2).[18] The racial makeup of the county was 52.6% white, 44.3% black or African American, 0.6% Asian, 0.4% American Indian, 0.7% from other races, and 1.5% from two or more races. Those of Hispanic or Latino origin made up 1.8% of the population.[17] In terms of ancestry, 11.5% were American, 5.7% were German, and 5.4% were English.[19]
Of the 8,937 households, 34.0% had children under the age of 18 living with them, 41.8% were married couples living together, 20.8% had a female householder with no husband present, 32.2% were non-families, and 28.4% of all households were made up of individuals. The average household size was 2.50 and the average family size was 3.05. The median age was 38.8 years.[17]
The median income for a household in the county was $33,816 and the median income for a family was $41,764. Males had a median income of $35,957 versus $30,291 for females. The per capita income for the county was $17,592. About 20.8% of families and 25.4% of the population were below the poverty line, including 39.6% of those under age 18 and 11.5% of those age 65 or over.[20]
2000 census
At the 2000 census,[21] there were 23,478 people, 9,021 households, and 6,431 families living in the county. The population density was 43 people per square mile (17 people/km2). There were 10,191 housing units at an average density of 19 units per square mile (7.3 units/km2). The racial makeup of the county was 55.18% White, 42.55% Black or African American, 0.35% Native American, 0.39% Asian, 0.03% Pacific Islander, 0.78% from other races, and 0.72% from two or more races. 1.39% of the population were Hispanic or Latino of any race.
There were 9,021 households, out of which 34.80% had children under the age of 18 living with them, 47.40% were married couples living together, 19.30% had a female householder with no husband present, and 28.70% were non-families. 25.60% of all households were made up of individuals, and 10.20% had someone living alone who was 65 years of age or older. The average household size was 2.57 and the average family size was 3.08.
In the county, the population was spread out, with 28.10% under the age of 18, 8.70% from 18 to 24, 27.90% from 25 to 44, 22.60% from 45 to 64, and 12.60% who were 65 years of age or older. The median age was 36 years. For every 100 females there were 92.70 males. For every 100 females age 18 and over, there were 86.50 males.
The median income for a household in the county was $28,591, and the median income for a family was $35,866. Males had a median income of $31,161 versus $21,904 for females. The per capita income for the county was $15,870. About 17.90% of families and 20.90% of the population were below the poverty line, including 27.30% of those under age 18 and 24.40% of those age 65 or over.
Government and politics
Prior to 1948, Barnwell County was a Democratic Party stronghold similar to the rest of the Solid South, with Democratic presidential candidates receiving near-unanimous margins of victory in most years. The twenty years from 1948 to 1968 were a highly transitional time for the politics of South Carolina & Barnwell County, largely in part due to the Democratic Party's increasing support for African-American civil rights & enfranchisement. Segregationist candidates Strom Thurmond & George Wallace won the county in those aforementioned years, bookended by Democratic wins in 1952 & 1956 & Republican wins in 1960 & 1964. From 1972 on, the county has primarily Republican, but has become more of a swing county in recent years, backing the national winner in every presidential election from 2000 on except for 2020.
| Year | Republican | Democratic | Third party | |||
|---|---|---|---|---|---|---|
| No. | % | No. | % | No. | % | |
| 2020 | 5,492 | 53.21% | 4,720 | 45.73% | 109 | 1.06% |
| 2016 | 4,889 | 51.54% | 4,400 | 46.39% | 196 | 2.07% |
| 2012 | 4,659 | 46.95% | 5,188 | 52.28% | 76 | 0.77% |
| 2008 | 4,769 | 48.67% | 4,931 | 50.33% | 98 | 1.00% |
| 2004 | 4,606 | 53.03% | 3,982 | 45.85% | 97 | 1.12% |
| 2000 | 4,521 | 54.63% | 3,661 | 44.24% | 94 | 1.14% |
| 1996 | 3,808 | 48.98% | 3,620 | 46.57% | 346 | 4.45% |
| 1992 | 4,026 | 49.24% | 3,344 | 40.90% | 807 | 9.87% |
| 1988 | 4,467 | 63.14% | 2,564 | 36.24% | 44 | 0.62% |
| 1984 | 4,346 | 60.45% | 2,811 | 39.10% | 32 | 0.45% |
| 1980 | 3,228 | 48.14% | 3,399 | 50.69% | 78 | 1.16% |
| 1976 | 2,569 | 38.62% | 4,083 | 61.38% | 0 | 0.00% |
| 1972 | 3,955 | 71.71% | 1,560 | 28.29% | 0 | 0.00% |
| 1968 | 1,849 | 31.25% | 1,716 | 29.01% | 2,351 | 39.74% |
| 1964 | 3,670 | 72.64% | 1,382 | 27.36% | 0 | 0.00% |
| 1960 | 1,842 | 58.05% | 1,331 | 41.95% | 0 | 0.00% |
| 1956 | 520 | 17.28% | 1,914 | 63.61% | 575 | 19.11% |
| 1952 | 657 | 29.14% | 1,598 | 70.86% | 0 | 0.00% |
| 1948 | 28 | 1.36% | 115 | 5.57% | 1,921 | 93.07% |
| 1944 | 8 | 0.53% | 1,482 | 98.41% | 16 | 1.06% |
| 1940 | 13 | 0.70% | 1,845 | 99.30% | 0 | 0.00% |
| 1936 | 2 | 0.09% | 2,157 | 99.91% | 0 | 0.00% |
| 1932 | 15 | 0.79% | 1,877 | 99.21% | 0 | 0.00% |
| 1928 | 34 | 3.20% | 1,028 | 96.80% | 0 | 0.00% |
| 1924 | 23 | 2.64% | 847 | 97.13% | 2 | 0.23% |
| 1920 | 25 | 3.35% | 721 | 96.65% | 0 | 0.00% |
| 1916 | 21 | 1.42% | 1,454 | 98.51% | 1 | 0.07% |
| 1912 | 15 | 1.29% | 1,139 | 98.27% | 5 | 0.43% |
| 1904 | 35 | 2.44% | 1,401 | 97.56% | 0 | 0.00% |
| 1900 | 57 | 4.03% | 1,356 | 95.97% | 0 | 0.00% |
Communities
City
- Barnwell (county seat and largest community)
Notable people
- James Brown (1933–2006), singer
- Rosa Louise Woodberry (1869–1932), journalist and school founder
- Sarah Lowe Twiggs (1839–1920), poet
See also
References
- "U.S. Census Bureau QuickFacts: Barnwell County, South Carolina". United States Census Bureau. Retrieved June 13, 2022.
- "Find a County". National Association of Counties. Archived from the original on July 12, 2012. Retrieved June 7, 2011.
- "South Carolina: Individual County Chronologies". South Carolina Atlas of Historical County Boundaries. The Newberry Library. 2009. Archived from the original on January 3, 2017. Retrieved March 20, 2015.
- Federal Writers' Project (1941). Palmetto Place Names. Sloane Printing Co. p. 12.
- The Governor: Powers, Practices, Roles and the South Carolina Experience Archived 2012-02-04 at the Wayback Machine, from the website of the USC South Carolina Governance Project. Retrieved February 5, 2010.
- "2020 County Gazetteer Files – South Carolina". United States Census Bureau. August 23, 2022. Retrieved September 10, 2023.
- "SCDNR Public Lands". www2.dnr.sc.gov. Retrieved April 1, 2023.
- "Georges Creek (in Barnwell County, SC)". southcarolina.hometownlocator.com. Retrieved July 18, 2022.
- "Par Pond Savannah River Site SRS". www.sciway.net. Retrieved July 18, 2022.
- Novak, Steven. "Fish Pond B - Barnwell County, South Carolina". Lake-Link. Retrieved July 24, 2022.
- "U.S. Decennial Census". United States Census Bureau. Retrieved March 16, 2015.
- "Historical Census Browser". University of Virginia Library. Retrieved March 16, 2015.
- Forstall, Richard L., ed. (March 27, 1995). "Population of Counties by Decennial Census: 1900 to 1990". United States Census Bureau. Retrieved March 16, 2015.
- "Census 2000 PHC-T-4. Ranking Tables for Counties: 1990 and 2000" (PDF). United States Census Bureau. April 2, 2001. Archived (PDF) from the original on October 9, 2022. Retrieved March 16, 2015.
- "State & County QuickFacts". United States Census Bureau. Archived from the original on June 6, 2011. Retrieved November 22, 2013.
- "Explore Census Data". data.census.gov. Retrieved December 14, 2021.
- "DP-1 Profile of General Population and Housing Characteristics: 2010 Demographic Profile Data". United States Census Bureau. Archived from the original on February 13, 2020. Retrieved March 9, 2016.
- "Population, Housing Units, Area, and Density: 2010 - County". United States Census Bureau. Archived from the original on February 13, 2020. Retrieved March 9, 2016.
- "DP02 SELECTED SOCIAL CHARACTERISTICS IN THE UNITED STATES – 2006-2010 American Community Survey 5-Year Estimates". United States Census Bureau. Archived from the original on February 13, 2020. Retrieved March 9, 2016.
- "DP03 SELECTED ECONOMIC CHARACTERISTICS – 2006-2010 American Community Survey 5-Year Estimates". United States Census Bureau. Archived from the original on February 13, 2020. Retrieved March 9, 2016.
- "U.S. Census website". United States Census Bureau. Retrieved May 14, 2011.
- Leip, David. "Dave Leip's Atlas of U.S. Presidential Elections". uselectionatlas.org. Retrieved March 13, 2018.
External links
 Geographic data related to Barnwell County, South Carolina at OpenStreetMap
- Official website
- Barnwell County history and images