Birch River, Manitoba
Birch River is a local urban district[1] in the northern portion of the Rural Municipality of Mountain, Manitoba, Canada. It is around 40 kilometers from Swan River, Manitoba.

Birch River
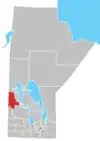
Location of Birch River in Manitoba
Demographics
In the 2021 Census of Population conducted by Statistics Canada, Birch River had a population of 144 living in 80 of its 96 total private dwellings, a change of -27.3% from its 2016 population of 198. With a land area of 1.84 km2 (0.71 sq mi), it had a population density of 78.3/km2 (202.7/sq mi) in 2021.[2]
Attractions
The 183 hectare Birch River Ecological Reserve is located within Porcupine Provincial Forest, just two kilometres north of the community of Birch River. Passive visits on foot are allowed without a permit. All other activities require prior approval.
Climate
| Climate data for Birch River | |||||||||||||
|---|---|---|---|---|---|---|---|---|---|---|---|---|---|
| Month | Jan | Feb | Mar | Apr | May | Jun | Jul | Aug | Sep | Oct | Nov | Dec | Year |
| Record high °C (°F) | 11.1 (52.0) |
10.6 (51.1) |
22.5 (72.5) |
31.7 (89.1) |
39.4 (102.9) |
35.5 (95.9) |
37.2 (99.0) |
35.6 (96.1) |
35.5 (95.9) |
29.5 (85.1) |
20 (68) |
13 (55) |
39.4 (102.9) |
| Average high °C (°F) | −13.8 (7.2) |
−8.5 (16.7) |
−1.1 (30.0) |
8.9 (48.0) |
17.4 (63.3) |
21.9 (71.4) |
24.4 (75.9) |
23.4 (74.1) |
16.9 (62.4) |
10 (50) |
−2.6 (27.3) |
−9.8 (14.4) |
7.3 (45.1) |
| Daily mean °C (°F) | −19.8 (−3.6) |
−14.6 (5.7) |
−7.4 (18.7) |
2.5 (36.5) |
10.3 (50.5) |
15 (59) |
17.7 (63.9) |
16.4 (61.5) |
10.5 (50.9) |
4.3 (39.7) |
−7.1 (19.2) |
−15.2 (4.6) |
1.1 (34.0) |
| Average low °C (°F) | −25.7 (−14.3) |
−20.7 (−5.3) |
−13.3 (8.1) |
−3.9 (25.0) |
3.1 (37.6) |
8.1 (46.6) |
11 (52) |
9.3 (48.7) |
4.1 (39.4) |
−1.3 (29.7) |
−11.4 (11.5) |
−20.4 (−4.7) |
−5.1 (22.8) |
| Record low °C (°F) | −48.3 (−54.9) |
−44.4 (−47.9) |
−37.8 (−36.0) |
−33.3 (−27.9) |
−11 (12) |
−3.3 (26.1) |
1.1 (34.0) |
−2.5 (27.5) |
−10.6 (12.9) |
−23 (−9) |
−37 (−35) |
−45 (−49) |
−48.3 (−54.9) |
| Average precipitation mm (inches) | 22.5 (0.89) |
20 (0.8) |
31.5 (1.24) |
31 (1.2) |
47.6 (1.87) |
86.6 (3.41) |
80.8 (3.18) |
64.9 (2.56) |
60.8 (2.39) |
31.3 (1.23) |
27.8 (1.09) |
25.5 (1.00) |
530.3 (20.88) |
| Source: Environment Canada[3] | |||||||||||||
References
- "Local Urban Districts Regulation". Government of Manitoba. 23 April 2016. Retrieved 24 April 2016.
- "Population and dwelling counts: Canada and designated places". Statistics Canada. 9 February 2022. Retrieved 3 September 2022.
- Environment Canada—Canadian Climate Normals 1971–2000, retrieved 27 April 2010
| Towns |
|  | ||
|---|---|---|---|---|
| Villages |
| |||
| Rural municipalities |
| |||
| Unorganized areas | ||||
| Unincorporated communities | ||||
This article is issued from Wikipedia. The text is licensed under Creative Commons - Attribution - Sharealike. Additional terms may apply for the media files.