Boone County, Kentucky
Boone County is a county located on the Ohio River in the northernmost part of the U.S. state of Kentucky. As of the 2020 census, the population was 135,968,[1] making it the fourth-most populous county in Kentucky. Its county seat is Burlington.[2] The county was formed in 1798 from a portion of Campbell County.[3] and was named for frontiersman Daniel Boone.[4] Boone County, with Kenton and Campbell Counties, is of the Northern Kentucky metro area, and the Cincinnati-Middletown, OH-KY-IN Metropolitan Statistical Area. It is the location of the Cincinnati/Northern Kentucky International Airport, which serves Cincinnati and the tri-state area.
Boone County | |
|---|---|
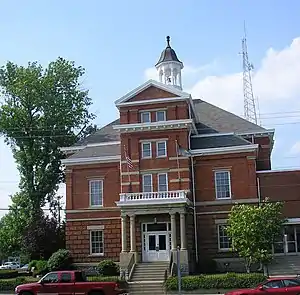
 The old Boone County courthouse in Burlington | |
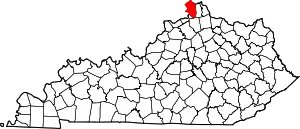
 Location within the U.S. state of Kentucky | |
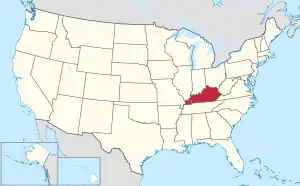
 Kentucky's location within the U.S. | |
| Coordinates: 38°58′N 84°44′W | |
| Country | |
| State | |
| Founded | 1798 |
| Named for | Daniel Boone |
| Seat | Burlington |
| Largest city | Florence |
| Area | |
| • Total | 256 sq mi (660 km2) |
| • Land | 246 sq mi (640 km2) |
| • Water | 10 sq mi (30 km2) 3.9% |
| Population (2020) | |
| • Total | 135,968 |
| • Estimate (2022) | 139,093 |
| • Density | 530/sq mi (210/km2) |
| Time zone | UTC−5 (Eastern) |
| • Summer (DST) | UTC−4 (EDT) |
| Congressional district | 4th |
| Website | www |
History
Native Americans had once inhabited a large late historic village in Petersburg that contained "at least two periods of habitation dating to 1150 A.D. and 1400 A.D."[5]
In 1729, an unknown Frenchman sketched an area on his chart at what is now Big Bone Lick State Park with a note that it was "where they found the bones of an elephant."[5] Another Frenchman, Charles le Moyne de Longueuil (1687–1755), would later be credited with being the first to investigate the Big Bone Lick area.[5]
In 1789, 10-year-old John Tanner was captured by Ojibwe Indians across from the mouth of the Great Miami River, while his Baptist minister father, brother, and their slaves were planting corn.
Boone County was created in 1798, and named after Daniel Boone.
Margaret Garner
On January 28, 1856, Robert and a pregnant Margaret "Peggy" Garner, together with family members, escaped and fled to Cincinnati, Ohio, along with several other slave families. Seventeen people were reported to have been in their party. In the coldest winter in 60 years, the Ohio River had frozen. The group crossed the ice just west of Covington, Kentucky at daybreak, and escaped to Cincinnati, then divided to avoid detection. They set out for Joseph Kite's house in Cincinnati.[6]
Margaret Garner would become famous for slitting her own daughter's throat (Mary) to prevent her from going back into slavery when Archibald K. Gaines and his posse, along with Federal Marshals, caught up to the fleeing slaves at Joseph Kite's house.[6]
Margaret Garner was first owned by, and may have been the daughter of, the plantation owner John Pollard Gaines himself.[7] In December 1849, the plantation was along with all the slaves to John P. Gaines' younger brother, Archibald K. Gaines.[7] The Gaines family lived on a farm called Maplewood in Boone County, Kentucky, just west of Richwood Presbyterian Church, of which Archibald K. Gaines was a member.[8] Three of Margaret Garner's children, including Mary, the daughter whose throat Margaret Garner slashed, were likely the children of Archibald K. Gaines, the only adult white male at Maplewood. The timing suggests they were each conceived after his wife had become pregnant and was unavailable to him.[9]
Margaret Garner's story was the inspiration for the novel Beloved (1987) by Nobel Prize winner Toni Morrison (that later was adapted into a film of the same name starring Oprah Winfrey), as well as for her libretto for the early 21st century opera Margaret Garner (2005), composed by Richard Danielpour.
Geography
According to the United States Census Bureau, the county has a total area of 256 square miles (660 km2), of which 246 square miles (640 km2) is land and 10 square miles (26 km2) (3.9%) is water.[10] Its location along the Ohio River was key to its early development, as the river was the major transportation route.
Adjacent counties
- Hamilton County, Ohio (north)
- Kenton County (east)
- Grant County (south)
- Gallatin County (southwest)
- Switzerland County, Indiana (west)
- Ohio County, Indiana (west)
- Dearborn County, Indiana (northwest)
Climate
Boone County's climate is hot-summer humid continental (Dfa) bordering on humid subtropical (Cfa).
| Climate data for Cincinnati (Cincinnati/Northern Kentucky Int'l), 1991–2020 normals,[lower-alpha 1] extremes 1871–present[lower-alpha 2] | |||||||||||||
|---|---|---|---|---|---|---|---|---|---|---|---|---|---|
| Month | Jan | Feb | Mar | Apr | May | Jun | Jul | Aug | Sep | Oct | Nov | Dec | Year |
| Record high °F (°C) | 77 (25) |
79 (26) |
88 (31) |
90 (32) |
95 (35) |
102 (39) |
108 (42) |
103 (39) |
102 (39) |
95 (35) |
82 (28) |
75 (24) |
108 (42) |
| Mean maximum °F (°C) | 61.8 (16.6) |
66.1 (18.9) |
74.3 (23.5) |
81.1 (27.3) |
86.7 (30.4) |
91.6 (33.1) |
93.6 (34.2) |
93.2 (34.0) |
90.7 (32.6) |
82.9 (28.3) |
72.0 (22.2) |
63.8 (17.7) |
95.3 (35.2) |
| Average high °F (°C) | 39.6 (4.2) |
43.7 (6.5) |
53.5 (11.9) |
65.5 (18.6) |
74.5 (23.6) |
82.6 (28.1) |
86.0 (30.0) |
85.2 (29.6) |
78.9 (26.1) |
66.7 (19.3) |
53.8 (12.1) |
43.3 (6.3) |
64.4 (18.0) |
| Daily mean °F (°C) | 31.4 (−0.3) |
34.7 (1.5) |
43.6 (6.4) |
54.6 (12.6) |
64.1 (17.8) |
72.3 (22.4) |
75.9 (24.4) |
74.9 (23.8) |
68.1 (20.1) |
56.2 (13.4) |
44.4 (6.9) |
35.6 (2.0) |
54.7 (12.6) |
| Average low °F (°C) | 23.1 (−4.9) |
25.8 (−3.4) |
33.8 (1.0) |
43.7 (6.5) |
53.7 (12.1) |
62.1 (16.7) |
65.9 (18.8) |
64.6 (18.1) |
57.3 (14.1) |
45.7 (7.6) |
35.1 (1.7) |
27.9 (−2.3) |
44.9 (7.2) |
| Mean minimum °F (°C) | 0.1 (−17.7) |
6.5 (−14.2) |
14.8 (−9.6) |
26.7 (−2.9) |
36.6 (2.6) |
49.2 (9.6) |
55.9 (13.3) |
54.6 (12.6) |
42.5 (5.8) |
29.8 (−1.2) |
19.0 (−7.2) |
9.1 (−12.7) |
−2.7 (−19.3) |
| Record low °F (°C) | −25 (−32) |
−17 (−27) |
−11 (−24) |
15 (−9) |
27 (−3) |
39 (4) |
47 (8) |
43 (6) |
31 (−1) |
16 (−9) |
0 (−18) |
−20 (−29) |
−25 (−32) |
| Average precipitation inches (mm) | 3.30 (84) |
3.17 (81) |
4.16 (106) |
4.53 (115) |
4.67 (119) |
4.75 (121) |
3.83 (97) |
3.43 (87) |
3.11 (79) |
3.35 (85) |
3.23 (82) |
3.73 (95) |
45.26 (1,150) |
| Average snowfall inches (cm) | 7.7 (20) |
6.7 (17) |
3.4 (8.6) |
0.4 (1.0) |
0.0 (0.0) |
0.0 (0.0) |
0.0 (0.0) |
0.0 (0.0) |
0.0 (0.0) |
0.2 (0.51) |
0.8 (2.0) |
4.1 (10) |
23.3 (59) |
| Average precipitation days (≥ 0.01 in) | 13.2 | 12.0 | 12.5 | 13.1 | 13.5 | 11.8 | 11.0 | 8.9 | 8.3 | 8.7 | 10.3 | 12.4 | 135.7 |
| Average snowy days (≥ 0.1 in) | 6.7 | 5.9 | 2.7 | 0.6 | 0.0 | 0.0 | 0.0 | 0.0 | 0.0 | 0.1 | 1.1 | 4.6 | 21.7 |
| Average relative humidity (%) | 72.2 | 70.1 | 67.0 | 62.8 | 66.9 | 69.2 | 71.5 | 72.3 | 72.7 | 69.2 | 71.0 | 73.8 | 69.9 |
| Average dew point °F (°C) | 19.9 (−6.7) |
22.5 (−5.3) |
31.3 (−0.4) |
39.6 (4.2) |
50.5 (10.3) |
59.7 (15.4) |
64.2 (17.9) |
63.0 (17.2) |
56.7 (13.7) |
43.7 (6.5) |
34.7 (1.5) |
25.5 (−3.6) |
42.6 (5.9) |
| Mean monthly sunshine hours | 120.8 | 128.4 | 170.1 | 211.0 | 249.9 | 275.5 | 277.0 | 261.5 | 234.4 | 188.8 | 118.7 | 99.3 | 2,335.4 |
| Percent possible sunshine | 40 | 43 | 46 | 53 | 56 | 62 | 61 | 62 | 63 | 55 | 39 | 34 | 52 |
| Average ultraviolet index | 2 | 3 | 5 | 6 | 8 | 9 | 9 | 8 | 7 | 4 | 2 | 2 | 5 |
| Source 1: NOAA (relative humidity and sun 1961–1990)[11][12][13][14] | |||||||||||||
| Source 2: Weather Atlas (UV)[15] | |||||||||||||
Demographics
| Census | Pop. | Note | %± |
|---|---|---|---|
| 1800 | 1,534 | — | |
| 1810 | 3,608 | 135.2% | |
| 1820 | 6,542 | 81.3% | |
| 1830 | 9,075 | 38.7% | |
| 1840 | 10,034 | 10.6% | |
| 1850 | 11,185 | 11.5% | |
| 1860 | 11,196 | 0.1% | |
| 1870 | 10,696 | −4.5% | |
| 1880 | 11,996 | 12.2% | |
| 1890 | 12,246 | 2.1% | |
| 1900 | 11,170 | −8.8% | |
| 1910 | 9,420 | −15.7% | |
| 1920 | 9,572 | 1.6% | |
| 1930 | 9,595 | 0.2% | |
| 1940 | 10,820 | 12.8% | |
| 1950 | 13,015 | 20.3% | |
| 1960 | 21,940 | 68.6% | |
| 1970 | 32,812 | 49.6% | |
| 1980 | 45,842 | 39.7% | |
| 1990 | 57,589 | 25.6% | |
| 2000 | 85,991 | 49.3% | |
| 2010 | 118,811 | 38.2% | |
| 2020 | 135,968 | 14.4% | |
| 2022 (est.) | 139,093 | [16] | 2.3% |
| U.S. Decennial Census[17] 1790–1960[18] 1900–1990[19] 1990–2000[20] 2010–2020[1] | |||
As of the census[21] of 2000, there were 85,991 people, 31,258 households, and 23,443 families residing in the county. The population density was 349 per square mile (135/km2). There were 33,351 housing units at an average density of 135 per square mile (52/km2). The racial makeup of the county was 95.15% White, 1.52% Black or African American, 0.23% Native American, 1.29% Asian, 0.03% Pacific Islander, 0.75% from other races, and 1.03% from two or more races. 1.98% of the population were Hispanic or Latino of any race.
There were 31,258 households, out of which 39.80% had children under the age of 18 living with them, 61.60% were married couples living together, 9.80% had a female householder with no husband present, and 25.00% were non-families. 20.20% of all households were made up of individuals, and 6.20% had someone living alone who was 65 years of age or older. The average household size was 2.73 and the average family size was 3.17.
In the county, the population was spread out, with 28.70% under the age of 18, 8.50% from 18 to 24, 33.50% from 25 to 44, 21.30% from 45 to 64, and 8.10% who were 65 years of age or older. The median age was 33 years. For every 100 females there were 97.70 males. For every 100 females age 18 and over, there were 94.70 males.
The median income for a household in the county was $53,593, and the median income for a family was $61,114. Males had a median income of $42,105 versus $27,414 for females. The per capita income for the county was $23,535. About 4.40% of families and 5.60% of the population were below the poverty line, including 6.40% of those under age 18 and 7.70% of those age 65 or over.
Politics
Boone County is a solidly Republican county in presidential elections; the last time it voted Democratic was in 1964, when Lyndon B. Johnson won in a national landslide. In 1976, however, the county gave exactly the same number of votes to Democrat Jimmy Carter and Republican Gerald Ford.
| Year | Republican | Democratic | Third party | |||
|---|---|---|---|---|---|---|
| No. | % | No. | % | No. | % | |
| 2020 | 44,814 | 66.89% | 20,901 | 31.20% | 1,283 | 1.91% |
| 2016 | 39,082 | 67.83% | 15,026 | 26.08% | 3,510 | 6.09% |
| 2012 | 35,922 | 68.41% | 15,629 | 29.76% | 960 | 1.83% |
| 2008 | 33,812 | 66.59% | 16,292 | 32.09% | 670 | 1.32% |
| 2004 | 32,329 | 71.71% | 12,391 | 27.49% | 362 | 0.80% |
| 2000 | 22,016 | 68.83% | 9,248 | 28.91% | 720 | 2.25% |
| 1996 | 15,085 | 58.91% | 8,379 | 32.72% | 2,143 | 8.37% |
| 1992 | 12,306 | 52.20% | 6,514 | 27.63% | 4,755 | 20.17% |
| 1988 | 12,667 | 69.76% | 5,382 | 29.64% | 108 | 0.59% |
| 1984 | 12,690 | 71.90% | 4,853 | 27.50% | 106 | 0.60% |
| 1980 | 8,263 | 58.40% | 5,374 | 37.98% | 511 | 3.61% |
| 1976 | 5,602 | 49.21% | 5,602 | 49.21% | 181 | 1.59% |
| 1972 | 7,355 | 71.55% | 2,595 | 25.24% | 330 | 3.21% |
| 1968 | 4,081 | 45.09% | 2,725 | 30.11% | 2,245 | 24.80% |
| 1964 | 3,430 | 40.25% | 5,077 | 59.58% | 15 | 0.18% |
| 1960 | 4,835 | 61.99% | 2,965 | 38.01% | 0 | 0.00% |
| 1956 | 3,139 | 51.54% | 2,933 | 48.16% | 18 | 0.30% |
| 1952 | 2,309 | 46.68% | 2,620 | 52.97% | 17 | 0.34% |
| 1948 | 1,151 | 32.20% | 2,320 | 64.90% | 104 | 2.91% |
| 1944 | 1,457 | 37.16% | 2,451 | 62.51% | 13 | 0.33% |
| 1940 | 1,357 | 34.90% | 2,518 | 64.76% | 13 | 0.33% |
| 1936 | 1,042 | 26.62% | 2,785 | 71.14% | 88 | 2.25% |
| 1932 | 1,355 | 27.52% | 3,536 | 71.83% | 32 | 0.65% |
| 1928 | 2,604 | 58.31% | 1,855 | 41.54% | 7 | 0.16% |
| 1924 | 1,340 | 36.39% | 2,204 | 59.86% | 138 | 3.75% |
| 1920 | 973 | 21.72% | 3,472 | 77.50% | 35 | 0.78% |
| 1916 | 531 | 20.84% | 2,008 | 78.81% | 9 | 0.35% |
| 1912 | 371 | 16.25% | 1,738 | 76.13% | 174 | 7.62% |
| 1908 | 631 | 23.29% | 2,041 | 75.34% | 37 | 1.37% |
| 1904 | 578 | 21.99% | 2,013 | 76.57% | 38 | 1.45% |
| 1900 | 759 | 24.69% | 2,302 | 74.89% | 13 | 0.42% |
| 1896 | 781 | 24.83% | 2,317 | 73.65% | 48 | 1.53% |
| 1892 | 545 | 20.99% | 2,009 | 77.39% | 42 | 1.62% |
| 1888 | 635 | 22.93% | 2,116 | 76.42% | 18 | 0.65% |
| 1884 | 529 | 23.49% | 1,694 | 75.22% | 29 | 1.29% |
| 1880 | 446 | 20.43% | 1,734 | 79.43% | 3 | 0.14% |
Before 2001, Boone County had a county police department providing general-service law enforcement to the unincorporated areas of the county. The police department was merged with the county sheriff's department in 2001, and the sheriff's department now serves that role.[23] As of 2022 the sheriff is Michael A. Helmig.[24]
The Boone County Jail is a short-term incarceration facility serving all law enforcement agencies in Boone County, including the Kentucky State Police, the Florence Police Department, the Boone County Sheriff's Office, and the Cincinnati/Northern Kentucky International Airport Police Department. The Boone County Jail system consists of the main jail and a workcamp facility. The Main Jail has the capacity of housing 424 maximum, medium, and minimum security inmates. The workcamp houses 76 minimum security inmates. As of 2022 the Jailer, who in Kentucky is elected separately from the Sheriff, is Jason Maydak.[25]
Economy
Boone County is the location of the Cincinnati/Northern Kentucky International Airport, which includes the headquarters of DHL Express and Southern Air.
Major attractions
The Creation Museum (Petersburg), operated by the apologetics ministry Answers in Genesis, as well as Big Bone Lick State Park, "birthplace of American paleontology," are located in Boone County.[26]
Education
Most of the county is within Boone County Schools. A portion is in Walton-Verona Independent School District.[27]
Communities
Census-designated places

- Burlington (county seat)
- Francisville
- Hebron
- Oakbrook
- Petersburg
- Rabbit Hash
- Verona
Other unincorporated communities
The Disunited States of America
In the novel The Disunited States of America, written by Harry Turtledove, the county of Boone is its own separate state.
See also
Notes
- Mean monthly maxima and minima (i.e. the expected highest and lowest temperature readings at any point during the year or given month) calculated based on data at said location from 1991 to 2020.
- Official records for Cincinnati kept at downtown from January 1871 to March 1915, at the Cincinnati Abbe Observatory just north of downtown from April 1915 to March 1947, and at KCVG near Hebron, Kentucky since April 1947. For more information, see Threadex and History of Weather Observations Cincinnati, Ohio 1789–1947.
References
- "State & County QuickFacts". United States Census Bureau. Retrieved June 28, 2022.
- "Find a County". National Association of Counties. Archived from the original on May 31, 2011. Retrieved June 7, 2011.
- Collins, Lewis (1882). Collins' Historical Sketches of Kentucky: History of Kentucky, Volume 2. Collins & Company. p. 26.
- The Register of the Kentucky State Historical Society, Volume 1. Kentucky State Historical Society. 1903. p. 34.
- "Boone County Fiscal Court: County History". Archived from the original on August 11, 2014. Retrieved October 4, 2014.
- "Margaret Garner Incident (1856) | The Black Past: Remembered and Reclaimed". The Black Past. Retrieved April 12, 2016.
- Steven Weisenburger, "A Historical Margaret Garner" Archived May 20, 2011, at the Wayback Machine, Michigan Opera Theatre. Retrieved April 20, 2009
- "Richwood, Kentucky". Nkyviews.com. Retrieved April 12, 2016.
- Steven Weisenburger, "A Historical Margaret Garner" Archived May 20, 2011, at the Wayback Machine, Michigan Opera Theatre. Retrieved April 20, 2009. "Bertram Wyatt-Brown reminds us, Southern men commonly referred to their pregnant wives' last trimester or so when they were sexually unavailable as "the gander months" because it was supposedly natural, and to some extent informally countenanced, for them to seek intimate "comfort" with unmarried women or with enslaved women, if they owned any."
- "2010 Census Gazetteer Files". United States Census Bureau. August 22, 2012. Archived from the original on August 12, 2014. Retrieved August 12, 2014.
- "NowData—NOAA Online Weather Data". National Oceanic and Atmospheric Administration. Retrieved May 9, 2021.
- "Station: Cincinnati Northern KY AP, KY". U.S. Climate Normals 2020: U.S. Monthly Climate Normals (1991–2020). National Oceanic and Atmospheric Administration. Retrieved May 9, 2021.
- "Records for Cincinnati". National Weather Service. Retrieved April 13, 2012.
- "WMO Climate Normals for CINCINNATI/GREATER CINCINNATI,KY 1961–1990". National Oceanic and Atmospheric Administration. Retrieved July 25, 2020.
- "Cincinnati, Ohio, USA - Monthly weather forecast and Climate data". Weather Atlas. Retrieved July 4, 2019.
- "Annual Estimates of the Resident Population for Counties: April 1, 2020 to July 1, 2022". United States Census Bureau. Retrieved April 2, 2023.
- "U.S. Decennial Census". United States Census Bureau. Retrieved August 12, 2014.
- "Historical Census Browser". University of Virginia Library. Retrieved August 12, 2014.
- "Population of Counties by Decennial Census: 1900 to 1990". United States Census Bureau. Retrieved August 12, 2014.
- "Census 2000 PHC-T-4. Ranking Tables for Counties: 1990 and 2000" (PDF). United States Census Bureau. Archived (PDF) from the original on March 27, 2010. Retrieved August 12, 2014.
- "U.S. Census website". United States Census Bureau. Retrieved January 31, 2008.
- Leip, David. "Dave Leip's Atlas of U.S. Presidential Elections". uselectionatlas.org.
- "Boone police merger approved". The Kentucky Enquirer. April 4, 2001. Retrieved July 8, 2012.
- "Boone County Sheriff's Office | Burlington, Kentucky". Boone County Sheriff's Office. Retrieved March 20, 2022.
- "Boone County Jail". boonecountyky.org. Retrieved March 20, 2022.
- "HomeTownLocator". Hometownlocator.com. Retrieved June 10, 2006.
- "2020 CENSUS - SCHOOL DISTRICT REFERENCE MAP: Boone County, KY" (PDF). U.S. Census Bureau. Retrieved August 8, 2023. - District text list