Brixton (UK Parliament constituency)
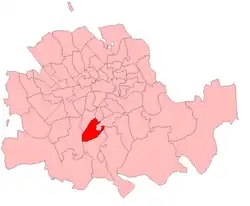
Brixton was a parliamentary constituency centred on the Brixton district of South London. It returned one Member of Parliament (MP) to the House of Commons of the Parliament of the United Kingdom, elected by the first-past-the-post system.
| Brixton | |
|---|---|
| Former Borough constituency for the House of Commons | |
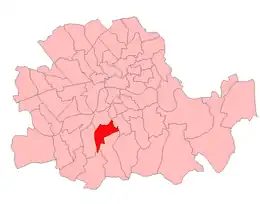
 Brixton in London 1885–1918 | |
| County | Greater London |
| 1885–1974 | |
| Seats | One |
| Created from | Lambeth |
| Replaced by | Lambeth Central |
History
The constituency was created for the 1885 general election, and abolished for the February 1974 general election, when it was largely replaced by the new Lambeth Central constituency.
Boundaries
1885–1918

The constituency was created by the Redistribution of Seats Act 1885, when the existing two-member Parliamentary Borough of Lambeth was divided into four single-member divisions.[1][2] The seat, formally known as Lambeth, Brixton Division, comprised part of the civil parish of Lambeth, and was defined in terms of the wards used for elections to the parish vestry under the Metropolis Management Act 1855 as follows:
1918–1950

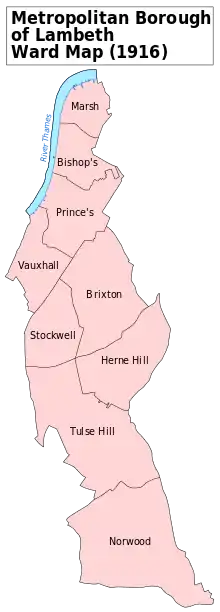
The Representation of the People Act 1918 redrew constituencies throughout Great Britain and Ireland. In London, the seats were redefined in terms of the wards of the Metropolitan Boroughs of the County of London, which had been created in 1900. Accordingly, the constituency was defined as consisting of the following areas of the Metropolitan Borough of Lambeth:
- Stockwell ward.
- The part of Brixton ward to the south of a line running from Clapham Road along the middle of Stockwell Park Road, Grove Road, Brixton Road, Mostyn Road, Akerman Road and Lothian Road and across Camberwell New Road to Wyndham Road.
- The part of Herne Hill Ward to the north of a line running from Coldharbour Lane along the north side of the London, Brighton and South Coast Railway to Denmark Hill.
- The part of Tulse Hill to the north and west of a line running along the middle of Brixton Hill from Mill Lane to Water Lane, along the middle of Water Lane to Effra Road, and along the middle of Effra Road to Coldharbour Lane.[2][3]
1950–1974

The final boundary change was made by the Representation of the People Act 1948, and came into effect at the 1950 general election. The 1948 Act introduced the term "borough constituency". Due to a population decrease in Lambeth, the number of constituencies in the borough was reduced from four to three. The new Lambeth Brixton Borough Constituency was defined as consisting of four wards of the metropolitan borough as they existed at the end of 1947:
Local government was completely reorganised in Greater London in 1965, and the metropolitan borough was abolished to be replaced by the larger London Borough of Lambeth. However these changes were not reflected in parliamentary boundaries until the general election of 1974. The Brixton constituency was largely replaced by the new seat of Lambeth Central[2]
Members of Parliament
| Election | Member | Party | |
|---|---|---|---|
| 1885 | Ernest Baggallay | Conservative | |
| 1887 by-election | Marquess of Carmarthen, later became The 10th Duke of Leeds in December 1895 | Conservative | |
| 1896 by-election | Evelyn Hubbard | Conservative | |
| 1900 by-election | Sir Robert Mowbray | Conservative | |
| 1906 | Joel Seaverns | Liberal | |
| 1910 | Davison Dalziel, later Baron Dalziel | Conservative | |
| 1923 | Frederick Joseph Laverack | Liberal | |
| 1924 | Davison Dalziel, later Baron Dalziel | Unionist | |
| 1927 by-election | Nigel Colman | Conservative | |
| 1945 | Marcus Lipton | Labour | |
| Feb 1974 | constituency abolished: see Lambeth Central | ||
Elections
Elections in the 1880s
| Party | Candidate | Votes | % | ±% | |
|---|---|---|---|---|---|
| Conservative | Ernest Baggallay | 3,427 | 55.4 | ||
| Liberal | William Blake Odgers | 2,762 | 44.6 | ||
| Majority | 665 | 10.8 | |||
| Turnout | 6,189 | 77.7 | |||
| Registered electors | 7,963 | ||||
| Conservative win (new seat) | |||||
| Party | Candidate | Votes | % | ±% | |
|---|---|---|---|---|---|
| Conservative | Ernest Baggallay | 3,300 | 63.6 | +8.2 | |
| Liberal | Montagu Hughes Cookson | 1,886 | 36.4 | −8.2 | |
| Majority | 1,414 | 27.2 | +16.4 | ||
| Turnout | 5,186 | 65.1 | −12.6 | ||
| Registered electors | 7,963 | ||||
| Conservative hold | Swing | +8.2 | |||
Baggallay resigned after being appointed a Metropolitan Police Magistrate, causing a by-election.
| Party | Candidate | Votes | % | ±% | |
|---|---|---|---|---|---|
| Conservative | George Osborne | 3,307 | 56.3 | −7.3 | |
| Liberal | James Hill | 2,569 | 43.7 | +7.3 | |
| Majority | 738 | 12.6 | −14.6 | ||
| Turnout | 5,876 | 69.5 | +4.4 | ||
| Registered electors | 8,455 | ||||
| Conservative hold | Swing | -7.3 | |||
Elections in the 1890s

| Party | Candidate | Votes | % | ±% | |
|---|---|---|---|---|---|
| Conservative | George Osborne | 4,061 | 55.9 | −7.7 | |
| Liberal | Richard Stapley | 3,204 | 44.1 | +7.7 | |
| Majority | 857 | 11.8 | −15.4 | ||
| Turnout | 7,265 | 74.2 | +9.1 | ||
| Registered electors | 9,789 | ||||
| Conservative hold | Swing | +7.7 | |||
| Party | Candidate | Votes | % | ±% | |
|---|---|---|---|---|---|
| Conservative | George Osborne | 4,199 | 65.6 | +9.7 | |
| Liberal | Sir Robert Garnett Head, 3rd Baronet | 2,199 | 34.4 | −9.7 | |
| Majority | 2,000 | 31.2 | +19.4 | ||
| Turnout | 6,398 | 62.4 | −11.8 | ||
| Registered electors | 10,253 | ||||
| Conservative hold | Swing | +9.7 | |||
| Party | Candidate | Votes | % | ±% | |
|---|---|---|---|---|---|
| Conservative | Evelyn Hubbard | 4,493 | 67.8 | +2.2 | |
| Liberal | E.W. Nunn | 2,131 | 32.2 | −2.2 | |
| Majority | 2,362 | 35.6 | +4.4 | ||
| Turnout | 6,624 | 64.1 | +1.7 | ||
| Registered electors | 10,327 | ||||
| Conservative hold | Swing | +2.2 | |||
Elections in the 1900s
| Party | Candidate | Votes | % | ±% | |
|---|---|---|---|---|---|
| Conservative | Robert Mowbray | Unopposed | |||
| Registered electors | 10,666 | ||||
| Conservative hold | |||||
| Party | Candidate | Votes | % | ±% | |
|---|---|---|---|---|---|
| Conservative | Robert Mowbray | Unopposed | |||
| Registered electors | 10,666 | ||||
| Conservative hold | |||||
| Party | Candidate | Votes | % | ±% | |
|---|---|---|---|---|---|
| Liberal | Joel Seaverns | 4,521 | 51.6 | New | |
| Conservative | Davison Dalziel | 4,235 | 48.4 | N/A | |
| Majority | 286 | 3.2 | N/A | ||
| Turnout | 8,756 | 79.5 | N/A | ||
| Registered electors | 11,010 | ||||
| Liberal gain from Conservative | Swing | N/A | |||
Elections in the 1910s
| Party | Candidate | Votes | % | ±% | |
|---|---|---|---|---|---|
| Conservative | Davison Dalziel | 5,465 | 55.2 | +6.8 | |
| Liberal | Joel Seaverns | 4,427 | 44.8 | −6.8 | |
| Majority | 1,038 | 10.4 | N/A | ||
| Turnout | 9,892 | 86.5 | +7.0 | ||
| Registered electors | 11,442 | ||||
| Conservative gain from Liberal | Swing | +6.8 | |||
| Party | Candidate | Votes | % | ±% | |
|---|---|---|---|---|---|
| Conservative | Davison Dalziel | 4,770 | 56.3 | +1.1 | |
| Liberal | Joel Seaverns | 3,702 | 43.7 | −1.1 | |
| Majority | 1,068 | 12.6 | +2.2 | ||
| Turnout | 8,472 | 74.0 | −12.5 | ||
| Registered electors | 11,442 | ||||
| Conservative hold | Swing | +1.1 | |||
General Election 1914–15:
Another General Election was required to take place before the end of 1915. The political parties had been making preparations for an election to take place and by the July 1914, the following candidates had been selected;
- Unionist: Davison Dalziel
- Liberal:
| Party | Candidate | Votes | % | ±% | |
|---|---|---|---|---|---|
| C | Unionist | Davison Dalziel | 9,902 | 61.3 | +5.0 |
| NFDDSS | Stephen Kelley | 3,641 | 22.6 | New | |
| Liberal | Horace Norton | 2,594 | 16.1 | −27.6 | |
| Majority | 6,261 | 38.7 | +26.1 | ||
| Turnout | 37,745 | 42.8 | −31.2 | ||
| Unionist hold | Swing | +17.3 | |||
| C indicates candidate endorsed by the coalition government. | |||||
Elections in the 1920s
| Party | Candidate | Votes | % | ±% | |
|---|---|---|---|---|---|
| Unionist | Davison Dalziel | 11,284 | 54.8 | −6.5 | |
| Liberal | Frederick Joseph Laverack | 9,316 | 45.2 | +29.1 | |
| Majority | 1,968 | 9.6 | −29.1 | ||
| Turnout | 20,600 | 52.8 | +10.0 | ||
| Registered electors | 39,004 | ||||
| Unionist hold | Swing | −17.8 | |||
| Party | Candidate | Votes | % | ±% | |
|---|---|---|---|---|---|
| Liberal | Frederick Joseph Laverack | 10,881 | 53.5 | +8.3 | |
| Unionist | Davison Dalziel | 9,476 | 46.5 | −8.3 | |
| Majority | 1,405 | 7.0 | N/A | ||
| Turnout | 20,357 | 51.9 | −0.9 | ||
| Registered electors | 39,189 | ||||
| Liberal gain from Unionist | Swing | +8.3 | |||
| Party | Candidate | Votes | % | ±% | |
|---|---|---|---|---|---|
| Unionist | Davison Dalziel | 15,755 | 56.6 | +10.1 | |
| Labour | James Adams | 7,210 | 25.9 | New | |
| Liberal | Frederick Joseph Laverack | 4,871 | 17.5 | −36.0 | |
| Majority | 8,545 | 30.7 | N/A | ||
| Turnout | 28,099 | 69.4 | +17.5 | ||
| Registered electors | 40,134 | ||||
| Unionist gain from Liberal | Swing | +18.9 | |||
| Party | Candidate | Votes | % | ±% | |
|---|---|---|---|---|---|
| Unionist | Nigel Colman | 10,358 | 48.1 | −8.5 | |
| Labour | James Adams | 6,032 | 28.0 | +2.1 | |
| Liberal | Frederick Joseph Laverack | 5,134 | 23.9 | +6.4 | |
| Majority | 4,326 | 20.1 | −10.6 | ||
| Turnout | 21,524 | 53.9 | −15.5 | ||
| Registered electors | 39,953 | ||||
| Unionist hold | Swing | −5.3 | |||
| Party | Candidate | Votes | % | ±% | |
|---|---|---|---|---|---|
| Unionist | Nigel Colman | 14,252 | 44.9 | −11.7 | |
| Labour | A.B. Bishop | 10,089 | 31.7 | +5.8 | |
| Liberal | Arthur Stanley Quick | 7,438 | 23.4 | +5.9 | |
| Majority | 4,163 | 13.2 | −17.5 | ||
| Turnout | 31,779 | 62.4 | −7.0 | ||
| Registered electors | 50,956 | ||||
| Unionist hold | Swing | −8.8 | |||
Elections in the 1930s
| Party | Candidate | Votes | % | ±% | |
|---|---|---|---|---|---|
| Conservative | Nigel Colman | 24,673 | 77.0 | +32.1 | |
| Labour | Edward Albert Radice | 7,358 | 23.0 | -8.7 | |
| Majority | 17,315 | 54.0 | +40.8 | ||
| Turnout | 52,569 | 60.9 | -1.5 | ||
| Conservative hold | Swing | +20.4 | |||
| Party | Candidate | Votes | % | ±% | |
|---|---|---|---|---|---|
| Conservative | Nigel Colman | 17,414 | 57.6 | -19.4 | |
| Labour | Marcus Lipton | 10,908 | 36.1 | +13.1 | |
| Liberal | Arthur Stanley Quick | 1,911 | 6.3 | New | |
| Majority | 6,506 | 21.5 | -32.5 | ||
| Turnout | 51,713 | 58.5 | +2.4 | ||
| Conservative hold | Swing | -16.3 | |||
General Election 1939–40
Another General Election was required to take place before the end of 1940. The political parties had been making preparations for an election to take place and by the Autumn of 1939, the following candidates had been selected;
- Conservative: Nigel Colman
- Labour: Marcus Lipton[7]
Elections in the 1940s
| Party | Candidate | Votes | % | ±% | |
|---|---|---|---|---|---|
| Labour | Marcus Lipton | 15,583 | 63.6 | +27.5 | |
| Conservative | Nigel Colman | 8,928 | 36.4 | -21.2 | |
| Majority | 6,655 | 27.2 | N/A | ||
| Turnout | 37,493 | 65.4 | +6.9 | ||
| Labour gain from Conservative | Swing | +24.4 | |||
Elections in the 1950s
| Party | Candidate | Votes | % | ±% | |
|---|---|---|---|---|---|
| Labour | Marcus Lipton | 24,015 | 52.8 | -10.8 | |
| Conservative | Anthony Herbert Foord | 18,957 | 41.7 | +5.3 | |
| Liberal | Enid Lakeman | 2,527 | 5.5 | New | |
| Majority | 5,058 | 11.1 | -16.1 | ||
| Turnout | 56,082 | 81.1 | +15.7 | ||
| Labour hold | Swing | -8.1 | |||
| Party | Candidate | Votes | % | ±% | |
|---|---|---|---|---|---|
| Labour | Marcus Lipton | 24,776 | 56.1 | +3.3 | |
| Conservative | Patricia M. Marlowe | 19,423 | 43.9 | +2.2 | |
| Majority | 5,353 | 12.2 | +1.1 | ||
| Turnout | 55,362 | 79.8 | -1.3 | ||
| Labour hold | Swing | +0.6 | |||
| Party | Candidate | Votes | % | ±% | |
|---|---|---|---|---|---|
| Labour | Marcus Lipton | 20,594 | 57.0 | +0.9 | |
| Conservative | William Roots | 15,559 | 43.0 | -0.9 | |
| Majority | 5,035 | 14.0 | +1.8 | ||
| Turnout | 53,045 | 68.2 | -11.6 | ||
| Labour hold | Swing | +0.9 | |||
| Party | Candidate | Votes | % | ±% | |
|---|---|---|---|---|---|
| Labour | Marcus Lipton | 18,117 | 53.1 | -3.9 | |
| Conservative | Brian Warren | 16,005 | 46.9 | +3.9 | |
| Majority | 2,112 | 6.2 | -7.8 | ||
| Turnout | 52,261 | 65.3 | -2.9 | ||
| Labour hold | Swing | -3.9 | |||
Elections in the 1960s
| Party | Candidate | Votes | % | ±% | |
|---|---|---|---|---|---|
| Labour | Marcus Lipton | 16,518 | 58.1 | +5.0 | |
| Conservative | Kenneth P. Payne | 11,934 | 41.9 | -5.0 | |
| Majority | 4,584 | 16.2 | +10.0 | ||
| Turnout | 49,903 | 57.0 | -8.3 | ||
| Labour hold | Swing | +5.0 | |||
| Party | Candidate | Votes | % | ±% | |
|---|---|---|---|---|---|
| Labour | Marcus Lipton | 16,634 | 61.3 | +3.2 | |
| Conservative | Piers Dixon | 10,500 | 38.7 | -3.2 | |
| Majority | 6,134 | 22.6 | +6.4 | ||
| Turnout | 47,615 | 57.0 | 0.0 | ||
| Labour hold | Swing | +3.2 | |||
Elections in the 1970s
| Party | Candidate | Votes | % | ±% | |
|---|---|---|---|---|---|
| Labour | Marcus Lipton | 13,053 | 57.3 | -4.0 | |
| Conservative | James W. Harkess | 9,727 | 42.7 | +4.0 | |
| Majority | 3,326 | 14.6 | -8.0 | ||
| Turnout | 43,372 | 52.5 | -4.5 | ||
| Labour hold | Swing | -4.0 | |||
References
- Redistribution of Seats Act 1885, (48 & 49 Vict.) C 23, Sixth Schedule: Divisions of Boroughs. Number, Names, Contents and Boundaries of Divisions.
- Youngs, Frederic A Jr. (1979). Guide to the Local Administrative Units of England, Vol.I: Southern England. London: Royal Historical Society. pp. 743, 764. ISBN 0-901050-67-9.
- Representation of the People Act 1918, Ninth Schedule, Redistribution of Seats, Part I: Parliamentary Boroughs (I) London
- Representation of the People Act 1948 (11 & 12 Geo. 6.) C. 65, First Schedule, Parliamentary Constituencies.
- Craig, FWS, ed. (1974). British Parliamentary Election Results: 1885-1918. London: Macmillan Press. p. 29. ISBN 9781349022984.
- British Parliamentary Election Results 1918–1949, FWS Craig
- Report of the Annual Conference of the Labour Party, 1939
- British Parliamentary Election Results 1950–1973, FWS Craig