Canterbury City Council elections
Canterbury City Council is the local authority for the City of Canterbury. The council is elected every four years.
Political control
The first election to the council was held in 1973, initially operating as a shadow authority before coming into its powers on 1 April 1974. Political control of the council since 1973 has been held by the following parties:
| Party in control | Years | |
|---|---|---|
| Conservative | 1973–1991 | |
| No overall control | 1991–2005 | |
| Conservative | 2005–2023 | |
| No overall control[1] | 2023–present | |
Leadership
The role of lord mayor in Canterbury is largely ceremonial. From 1974 to 2002 political leadership was provided by the chair of the policy committee, and if that person's party had a majority of the seats on the council they would also take the title "leader of the council". The role of leader was made a formal appointment in 2002. The leaders (or chairs of the policy committee prior to 2002) have been:[2]
| Councillor | Party | From | To | |
|---|---|---|---|---|
| Arthur Porter[3] | Conservative | 1 Apr 1974 | 19 May 1982 | |
| Jim Nock | Conservative | 19 May 1982 | 31 Aug 1986 | |
| Peter Lee[4] | Conservative | 1 Sep 1986 | 10 May 1987 | |
| Jim Nock[5] | Conservative | 21 May 1987 | 9 May 1990 | |
| David Pentin | Conservative | 10 May 1990 | 16 May 1991 | |
| Jackie Hayes | Liberal Democrats | 16 May 1991 | 21 Feb 1994 | |
| Terry Rees | Labour | 11 Apr 1994 | 19 May 1994 | |
| Celia Rigden[6] | Independent | 19 May 1994 | 15 Aug 1994 | |
| Marion Attwood | Conservative | 15 Aug 1994 | 3 Oct 1994 | |
| Iain Douglas | Labour | 3 Oct 1994 | 21 Nov 1994 | |
| Celia Rigden | Independent | 21 Nov 1994 | 7 May 1995 | |
| Peter Wales | Liberal Democrats | 18 May 1995 | 1 Dec 1997 | |
| Martin Vye | Liberal Democrats | 1 Dec 1997 | 20 May 1999 | |
| (rotating chairs between Conservative, Labour and Liberal Democrat group leaders) | 20 May 1999 | 8 May 2002 | ||
| Alex Perkins | Liberal Democrats | 8 May 2002 | 11 May 2005 | |
| Harry Cragg | Conservative | 11 May 2005 | 16 May 2007 | |
| John Gilbey | Conservative | 16 May 2007 | 10 May 2015 | |
| Simon Cook | Conservative | 20 May 2015 | 5 May 2019 | |
| Rob Thomas | Conservative | 22 May 2019 | 10 Sep 2020 | |
| Ben Fitter-Harding | Conservative | 10 Sep 2020 | 17 May 2023 | |
| Alan Baldock | Labour | 17 May 2023 | ||
Council elections
- 1973 Canterbury City Council election
- 1976 Canterbury City Council election
- 1979 Canterbury City Council election (New ward boundaries)[7]
- 1983 Canterbury City Council election
- 1987 Canterbury City Council election (City boundary changes took place but the number of seats remained the same)[8][9]
- 1991 Canterbury City Council election
- 1995 Canterbury City Council election
- 1999 Canterbury City Council election
- 2003 Canterbury City Council election (New ward boundaries)[10]
- 2007 Canterbury City Council election
- 2011 Canterbury City Council election
- 2015 Canterbury City Council election (New ward boundaries)[11]
- 2019 Canterbury City Council election
- 2023 Canterbury City Council election
Result maps
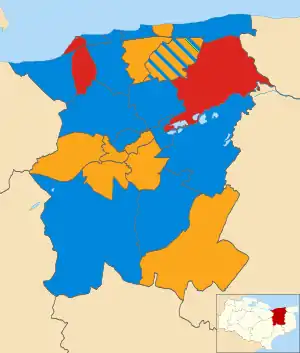 2003 results map
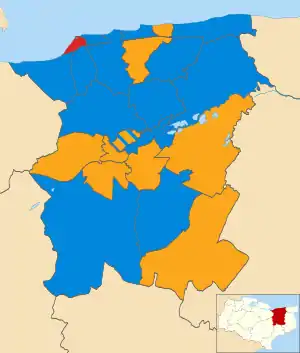 2007 results map
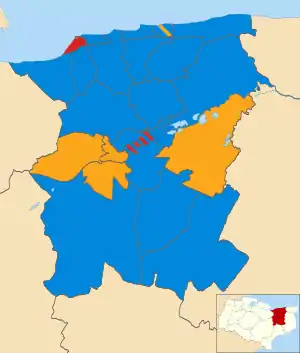 2011 results map
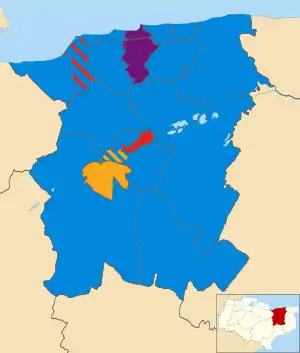 2015 results map
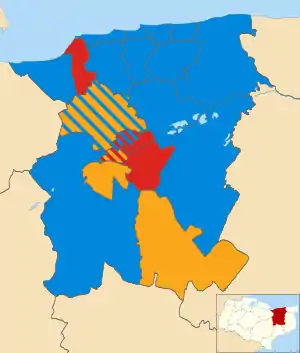 2019 results map
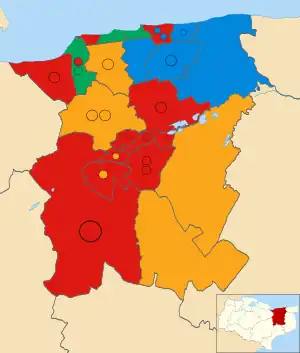 2023 results map
By-election results
1995-1999
| Party | Candidate | Votes | % | ±% | |
|---|---|---|---|---|---|
| Conservative | Ian Thomas | 564 | 35.1 | ||
| Liberal Democrats | 552 | 34.4 | |||
| Labour | 490 | 30.5 | |||
| Majority | 12 | 0.7 | |||
| Turnout | 1,606 | 51.0 | |||
| Conservative gain from Liberal Democrats | Swing | ||||
| Party | Candidate | Votes | % | ±% | |
|---|---|---|---|---|---|
| Labour | 577 | 44.1 | -12.1 | ||
| Conservative | 567 | 43.3 | +11.3 | ||
| Liberal Democrats | 151 | 11.5 | -0.4 | ||
| UKIP | 14 | 1.1 | +1.1 | ||
| Majority | 10 | 0.8 | |||
| Turnout | 1,309 | ||||
| Labour hold | Swing | ||||
| Party | Candidate | Votes | % | ±% | |
|---|---|---|---|---|---|
| Labour | 313 | 49.8 | -13.2 | ||
| Conservative | 183 | 29.1 | +2.0 | ||
| Liberal Democrats | 133 | 21.1 | +13.8 | ||
| Majority | 130 | 20.7 | |||
| Turnout | 629 | ||||
| Labour hold | Swing | ||||
1999-2003
| Party | Candidate | Votes | % | ±% | |
|---|---|---|---|---|---|
| Liberal Democrats | Heather Lloyd | 329 | 38.3 | +21.6 | |
| Conservative | Elizabeth Taylor | 289 | 33.7 | -0.6 | |
| Labour | Alan Thomas | 241 | 28.1 | -21.0 | |
| Majority | 40 | 4.6 | |||
| Turnout | 859 | 44.3 | |||
| Liberal Democrats gain from Labour | Swing | ||||
| Party | Candidate | Votes | % | ±% | |
|---|---|---|---|---|---|
| Liberal Democrats | Nigel Oakes | 867 | 37.6 | +5.2 | |
| Conservative | Alan White | 797 | 34.5 | +9.0 | |
| Labour | David Hornsby | 344 | 14.9 | -2.6 | |
| Green | Carol Davis | 187 | 8.1 | -3.0 | |
| UKIP | John Moore | 112 | 4.9 | +4.9 | |
| Majority | 70 | 3.1 | |||
| Turnout | 2,307 | 26.8 | |||
| Liberal Democrats hold | Swing | ||||
| Party | Candidate | Votes | % | ±% | |
|---|---|---|---|---|---|
| Conservative | Michael Northey | 1,184 | 35.4 | -2.3 | |
| Liberal Democrats | Valerie Ainscough | 1,177 | 35.2 | -11.6 | |
| Labour | Theresa Mawson | 824 | 24.6 | +9.0 | |
| Green | Steven Dawe | 163 | 4.9 | +4.9 | |
| Majority | 7 | 0.2 | |||
| Turnout | 3,348 | 62.4 | |||
| Conservative gain from Liberal Democrats | Swing | ||||
2003-2007
| Party | Candidate | Votes | % | ±% | |
|---|---|---|---|---|---|
| Conservative | John Anderson | 544 | 50.9 | -5.3 | |
| Liberal Democrats | Janet Horsley | 478 | 44.7 | +0.9 | |
| UKIP | John Moore | 26 | 2.4 | +2.4 | |
| Labour | Paul Todd | 21 | 2.0 | +2.0 | |
| Majority | 66 | 6.2 | |||
| Turnout | 1,069 | 53.0 | |||
| Conservative hold | Swing | ||||
| Party | Candidate | Votes | % | ±% | |
|---|---|---|---|---|---|
| Conservative | Michael Northey | 820 | 44.8 | +10.4 | |
| Liberal Democrats | James Flanagan | 697 | 38.0 | -4.3 | |
| Green | Keith Bothwell | 145 | 7.9 | +0.9 | |
| Labour | Laurence Ward | 100 | 5.5 | -5.1 | |
| Council Tax Payers Party | James Cooper | 70 | 3.8 | -2.0 | |
| Majority | 123 | 6.8 | |||
| Turnout | 1,832 | 31.8 | |||
| Conservative gain from Liberal Democrats | Swing | ||||
| Party | Candidate | Votes | % | ±% | |
|---|---|---|---|---|---|
| Conservative | Vincent McMahan | 1,177 | 37.6 | -13.2 | |
| Liberal Democrats | Kevin Sims | 992 | 31.7 | +13.5 | |
| Labour | Brian Hunter | 754 | 24.1 | -6.9 | |
| UKIP | John Moore | 205 | 6.6 | +6.6 | |
| Majority | 185 | 5.9 | |||
| Turnout | 3,128 | 67.5 | |||
| Conservative hold | Swing | ||||
| Party | Candidate | Votes | % | ±% | |
|---|---|---|---|---|---|
| Conservative | Heather Taylor | 474 | 52.4 | -23.1 | |
| Liberal Democrats | David Mummery | 318 | 35.1 | +23.3 | |
| Labour | Andrew Fenyo | 89 | 9.8 | -2.8 | |
| Independent | John Moore | 24 | 2.6 | +2.6 | |
| Majority | 156 | 17.3 | |||
| Turnout | 905 | 41.3 | |||
| Conservative hold | Swing | ||||
2007-2011
| Party | Candidate | Votes | % | ±% | |
|---|---|---|---|---|---|
| Liberal Democrats | Michael Steed | 993 | 51.8 | +9.3 | |
| Conservative | Mark Evans | 701 | 36.6 | +2.7 | |
| Green | Keith Bothwell | 121 | 6.3 | +6.3 | |
| Independent | Blue Cooper | 102 | 5.3 | -0.7 | |
| Majority | 292 | 15.2 | |||
| Turnout | 1,917 | 33.1 | |||
| Liberal Democrats hold | Swing | ||||
2011-2015
| Party | Candidate | Votes | % | ±% | |
|---|---|---|---|---|---|
| Conservative | Ben Fitter | 342 | 44.2 | -7.5 | |
| Labour | Carol Goldstein | 185 | 23.9 | +23.9 | |
| Liberal Democrats | Dan Smith | 121 | 15.6 | +0.4 | |
| Green | Russell Page | 64 | 8.3 | -24.8 | |
| UKIP | Howard Farmer | 38 | 4.9 | +4.9 | |
| Independent | John Hippisley | 24 | 3.1 | +3.1 | |
| Majority | 157 | 20.3 | |||
| Turnout | 774 | ||||
| Conservative hold | Swing | ||||
| Party | Candidate | Votes | % | ±% | |
|---|---|---|---|---|---|
| Conservative | Louise Morgan | 789 | 38.4 | -21.5 | |
| UKIP | Howard Farmer | 706 | 34.3 | +34.3 | |
| Labour | Rachel Goodwin | 427 | 20.8 | -6.7 | |
| Liberal Democrats | Debra Enever | 93 | 4.5 | -8.1 | |
| TUSC | Eriks Puce | 41 | 2.0 | +2.0 | |
| Majority | 83 | 4.0 | |||
| Turnout | 2,056 | ||||
| Conservative hold | Swing | ||||
| Party | Candidate | Votes | % | ±% | |
|---|---|---|---|---|---|
| UKIP | Mike Bull | 644 | 38.5 | +38.5 | |
| Conservative | Annette Stein | 522 | 31.2 | -28.7 | |
| Labour | Rachel Goodwin | 307 | 18.3 | -9.2 | |
| Liberal Democrats | Keith Hooker | 147 | 8.8 | -3.8 | |
| Green | Russell Page | 54 | 3.2 | +3.2 | |
| Majority | 122 | 7.3 | |||
| Turnout | 1,674 | ||||
| UKIP gain from Conservative | Swing | ||||
| Party | Candidate | Votes | % | ±% | |
|---|---|---|---|---|---|
| Liberal Democrats | Michael Sole | 337 | 37.3 | -3.4 | |
| Conservative | Stuart Walker | 285 | 31.5 | -11.4 | |
| UKIP | Dave de Boick | 164 | 18.1 | +18.1 | |
| Labour | David Wilson | 78 | 8.6 | +8.6 | |
| Green | Pat Marsh | 40 | 4.4 | -12.0 | |
| Majority | 52 | 5.8 | |||
| Turnout | 904 | ||||
| Liberal Democrats gain from Conservative | Swing | ||||
2015-2019
| Party | Candidate | Votes | % | ±% | |
|---|---|---|---|---|---|
| Conservative | Ann Taylor | 421 | 39.3 | -31.7 | |
| UKIP | Mick O'Brien | 306 | 28.6 | +28.6 | |
| Labour | Simon Warley | 251 | 23.4 | -5.6 | |
| Liberal Democrats | Ann Anderson | 93 | 8.7 | +8.7 | |
| Majority | 115 | 10.7 | |||
| Turnout | 1,071 | ||||
| Conservative hold | Swing | ||||
| Party | Candidate | Votes | % | ±% | |
|---|---|---|---|---|---|
| Labour | Simon Warley | 1,761 | 43.4 | +24.1 | |
| Liberal Democrats | Daniel Prevett | 978 | 24.1 | +0.7 | |
| Conservative | Luke Whiddett | 929 | 22.9 | -3.8 | |
| Green | Henry Stanton | 389 | 9.6 | -9.8 | |
| Majority | 783 | 19.3 | |||
| Turnout | 4,057 | ||||
| Labour gain from Conservative | Swing | ||||
2019-2023
| Party | Candidate | Votes | % | ±% | |
|---|---|---|---|---|---|
| Conservative | Ben Fitter-Harding | 728 | 46.0 | -6.5 | |
| Liberal Democrats | Peter Old | 562 | 35.5 | +18.9 | |
| Labour | Morag Warren | 140 | 8.8 | -6.9 | |
| Independent | Joe Egerton | 84 | 5.3 | +5.3 | |
| Green | Nicole David | 68 | 4.3 | -10.9 | |
| Majority | 166 | 10.5 | |||
| Turnout | 1,582 | ||||
| Conservative hold | Swing | ||||
| Party | Candidate | Votes | % | ±% | |
|---|---|---|---|---|---|
| Conservative | Mark Dance | 616 | 42.6 | -3.7 | |
| Green | Keith Bothwell | 527 | 36.5 | +20.6 | |
| Labour | Craig Potter | 278 | 19.2 | -11.6 | |
| Independent | Joe Egerton | 24 | 1.7 | +1.7 | |
| Majority | 89 | 6.2 | |||
| Turnout | 1,445 | ||||
| Conservative hold | Swing | ||||
| Party | Candidate | Votes | % | ±% | |
|---|---|---|---|---|---|
| Labour | Pip Hazelton | 842 | 39.2 | +5.4 | |
| Liberal Democrats | Alex Lister | 661 | 30.8 | -6.5 | |
| Conservative | Jake Warman | 404 | 18.8 | +9.2 | |
| Green | Terry Thompson | 242 | 11.3 | +2.0 | |
| Majority | 181 | 8.4 | |||
| Turnout | 2,149 | ||||
| Labour hold | Swing | ||||
| Party | Candidate | Votes | % | ±% | |
|---|---|---|---|---|---|
| Green | Clare Turnbull | 1,149 | 43.9 | +10.3 | |
| Labour | Dane Buckman | 803 | 30.7 | -6.0 | |
| Conservative | Stephen Spencer | 608 | 23.2 | +0.2 | |
| Workers Party | Colin Gardner | 58 | 2.2 | +2.2 | |
| Majority | 346 | 13.2 | |||
| Turnout | 2,618 | ||||
| Green gain from Labour | Swing | ||||
References
- Pallant, James (5 April 2023). "Conservative Party loses majority on Canterbury City Council after councillor defections". Kent Online. Retrieved 30 April 2023.
- "Council minutes". Canterbury City Council. Retrieved 26 July 2022.
- "Once the leader... now the mayor". Whitstable Times. 21 May 1982. p. 12. Retrieved 26 July 2022.
- "Lee is new leader". Whitstable Times. 21 August 1986. p. 5. Retrieved 26 July 2022.
- "Tories take the lot in council election". Whitstable Times. 14 May 1987. p. 1. Retrieved 26 July 2022.
- "Tories blamed for resignation". Whitstable Times. 28 October 1993. Retrieved 26 July 2022.
Veteran Whitstable councillor Celia Rigden has resigned from the Conservative group... will now sit as an independent...
- The City of Canterbury (Electoral Arrangements) Order 1976
- The Canterbury and Shepway (Areas) Order 1985
- legislation.gov.uk - The Kent (District Boundaries) Order 1987. Retrieved on 6 November 2015.
- legislation.gov.uk - The City of Canterbury (Electoral Changes) Order 2001. Retrieved on 4 October 2015.
- "The Canterbury (Electoral Changes) Order 2014". legislation.gov.uk.
- "Barton Ward By Election Results". Canterbury City Council. Archived from the original on 23 December 2012. Retrieved 20 July 2008.
- "Local Elections Archive Project — Blean Forest Ward". www.andrewteale.me.uk. Retrieved 27 December 2022.
- "Local Elections Archive Project — Seasalter Ward". www.andrewteale.me.uk. Retrieved 27 December 2022.
- "Local Elections Archive Project — Seasalter Ward". www.andrewteale.me.uk. Retrieved 27 December 2022.
- "Local Elections Archive Project — Barham Downs Ward". www.andrewteale.me.uk. Retrieved 27 December 2022.
- "Local Elections Archive Project — Reculver Ward". www.andrewteale.me.uk. Retrieved 27 December 2022.
- "Local Elections Archive Project — Westgate Ward". www.andrewteale.me.uk. Retrieved 27 December 2022.
- "Local Elections Archive Project — Chestfield Ward". www.andrewteale.me.uk. Retrieved 27 December 2022.
- "Local Elections Archive Project — Swalecliffe Ward". www.andrewteale.me.uk. Retrieved 27 December 2022.
- "Local Elections Archive Project — Westgate Ward". www.andrewteale.me.uk. Retrieved 27 December 2022.
- "Local Elections Archive Project — Gorrell Ward". www.andrewteale.me.uk. Retrieved 27 December 2022.
External links
This article is issued from Wikipedia. The text is licensed under Creative Commons - Attribution - Sharealike. Additional terms may apply for the media files.