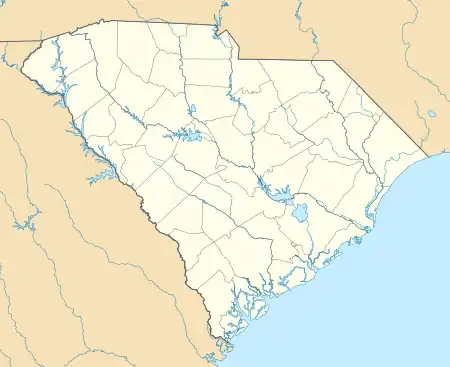
Capitol View, South Carolina
Capitol View is an unincorporated part of Richland County, South Carolina, United States, consisting of several neighborhoods that are next to the city of Columbia, the state capital. The area was first listed as a census-designated place (CDP) prior to the 2020 census.[2] In 2020 its population was 4,653.[4]
Capitol View, South Carolina | |
|---|---|
 Capitol View  Capitol View | |
| Coordinates: 33°57′59″N 80°55′27″W | |
| Country | United States |
| State | South Carolina |
| County | Richland |
| Area | |
| • Total | 1.67 sq mi (4.33 km2) |
| • Land | 1.64 sq mi (4.25 km2) |
| • Water | 0.03 sq mi (0.08 km2) |
| Elevation | 256 ft (78 m) |
| Population | |
| • Total | 4,653 |
| • Density | 2,838.93/sq mi (1,095.99/km2) |
| Time zone | UTC-5 (Eastern (EST)) |
| • Summer (DST) | UTC-4 (EDT) |
| ZIP Code | 29209 (Columbia) |
| Area code(s) | 803/839 |
| FIPS code | 45-11620 |
| GNIS feature ID | 2807074[2] |
Geography
The CDP is in central Richland County and is bordered to the north, west, and south by the city of Columbia. It is bordered to the east by Mill Creek and Sun View Lake, a reservoir on the creek, which is a south-flowing tributary of the Congaree River. The CDP consists of the neighborhoods of Village Bond, Capitol View, and Hazelwood Acres in the northwest; Charlestown in the northeast; and Eastmont in the south. The northwest and northeast arms of the CDP are separated by the neighborhoods of Galaxy and Strathaven Forest, both within the Columbia city limits.[5]
South Carolina Highway 262 (Leesburg Road) runs through the northern side of the CDP, leading west 1 mile (1.6 km) to Interstate 77 at Exit 9 and east 13 miles (21 km) along the southern edge of Fort Jackson to U.S. Route 601. U.S. Routes 76 and 378 (Garners Ferry Road) forms the southern edge of the CDP, leading northwest 8 miles (13 km) to downtown Columbia and east 35 miles (56 km) to Sumter.
2020 census
| Census | Pop. | Note | %± |
|---|---|---|---|
| 2020 | 4,653 | — | |
| U.S. Decennial Census[6] 2020[7][3] | |||
| Race / Ethnicity | Pop 2020[7] | % 2020 |
|---|---|---|
| White alone (NH) | 1,486 | 31.94% |
| Black or African American alone (NH) | 2,637 | 56.67% |
| Native American or Alaska Native alone (NH) | 9 | 0.19% |
| Asian alone (NH) | 52 | 1.12% |
| Pacific Islander alone (NH) | 3 | 0.06% |
| Some Other Race alone (NH) | 19 | 0.41% |
| Mixed Race/Multi-Racial (NH) | 152 | 3.27% |
| Hispanic or Latino (any race) | 295 | 6.34% |
| Total | 4,653 | 100.00% |
Note: the US Census treats Hispanic/Latino as an ethnic category. This table excludes Latinos from the racial categories and assigns them to a separate category. Hispanics/Latinos can be of any race.
References
- "ArcGIS REST Services Directory". United States Census Bureau. Retrieved October 15, 2022.
- U.S. Geological Survey Geographic Names Information System: Capitol View, South Carolina
- "Census Population API". United States Census Bureau. Retrieved October 15, 2022.
- "Capitol View CDP, South Carolina". United States Census Bureau. Retrieved February 23, 2021.
- "Capitol View, SC". ACME Mapper. Retrieved September 8, 2021.
- "Decennial Census of Population and Housing by Decades". US Census Bureau.
- "P2 HISPANIC OR LATINO, AND NOT HISPANIC OR LATINO BY RACE - 2020: DEC Redistricting Data (PL 94-171) - Capitol View CDP, South Carolina". United States Census Bureau.
