Cartwright-L'Anse au Clair
Cartwright-L'Anse au Clair is a provincial electoral district for the House of Assembly of Newfoundland and Labrador, Canada. As of 2011, there are 3,131 eligible voters living within the district.[1]
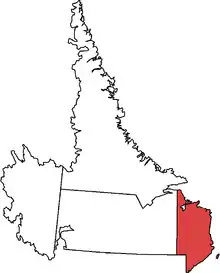 Cartwright-L'Anse au Clair in relation to other districts in Labrador | |||
| Provincial electoral district | |||
| Legislature | Newfoundland and Labrador House of Assembly | ||
| MHA |
Liberal | ||
| District created | 1975 | ||
| First contested | 1975 | ||
| Last contested | 2021 | ||
| Demographics | |||
| Population (2006) | 4,713 | ||
| Electors (2011) | 3,131 | ||
| Census division(s) | Division No. 10 | ||
| Census subdivision(s) | Cartwright, Charlottetown, Division No. 10, Subdivision A, Division No. 10, Subdivision B, Forteau, L'Anse-au-Clair, L'Anse-au-Loup, Mary's Harbour, Pinware, Port Hope Simpson, Red Bay, St. Lewis, West St. Modeste | ||
The district covers remote communities in Southern Labrador that are mostly dependent on fishery. The district includes: Black Tickle, Charlottetown, Capstan Island, Cartwright, Domino, Forteau, L'Anse Amour, L'Anse au Clair, L'Anse au Loup, Lodge Bay, Mary's Harbour, Norman Bay, Paradise River, Pinsent's Arm, Pinware, Port Hope Simpson, Red Bay, St. Lewis, West St. Modeste and William's Harbour.
The district is considered one of the safest Liberal seats in the province; on only one occasion in 32 years have voters not elected a Liberal, and even then – in 1996 – it was with a Liberal running as an Independent; Yvonne Jones was a mainstay of the Liberal caucus after that, and served as Liberal party leader from 2007 to 2011. She resigned to take up a seat in the House of Commons in 2013. Lisa Dempster was elected as her replacement, and has represented the seat since then.
Members of the House of Assembly
| Assembly | Years | Member | Party | |
|---|---|---|---|---|
| Labrador South | ||||
| 31st | 1956-1959 | George Sellars | Liberal | |
| 32nd | 1959-1962 | |||
| 33rd | 1963-1966 | Gerald I. Hill | ||
| 34th | 1966-1971 | |||
| 35th | 1971-1972 | Josiah Boyd Harvey | ||
| 36th | 1972-1972 | |||
| 1972-1975 | Michael S. Martin | Labrador Party | ||
| Eagle River | ||||
| 37th | 1975-1979 | Ian Strachan | Liberal | |
| 38th | 1979-1982 | Eugene Hiscock | ||
| 39th | 1982-1985 | |||
| 40th | 1985-1989 | |||
| 41st | 1989-1993 | Danny Dumaresque | ||
| 42nd | 1993-1996 | |||
| Cartright - L'Anse au Clair | ||||
| 43rd | 1996-1999 | Yvonne Jones | Independent | |
| 44th | 1999-2003 | Liberal | ||
| 45th | 2003-2007 | |||
| 46th | 2007-2011 | |||
| 47th | 2011-2013 | |||
| 2013-2015 | Lisa Dempster | |||
| 48th | 2015-2019 | |||
| 49th | 2019-2021 | |||
| 50th | 2021-Present | |||
Election results
Cartwright-L'Anse au Clair
| 2021 Newfoundland and Labrador general election | ||||||||
|---|---|---|---|---|---|---|---|---|
| Party | Candidate | Votes | % | ±% | ||||
| Liberal | Lisa Dempster | 973 | 95.21 | +27.98 | ||||
| Progressive Conservative | Joshua Nolan | 49 | 4.79 | -27.98 | ||||
| Total valid votes | 1,022 | |||||||
| Total rejected ballots | ||||||||
| Turnout | ||||||||
| Eligible voters | ||||||||
| Liberal hold | Swing | +27.98 | ||||||
Source(s)
"Officially Nominated Candidates General Election 2021" (PDF). Elections Newfoundland and Labrador. Retrieved 3 March 2021. "NL Election 2021 (Unofficial Results)". Retrieved 27 March 2021. | ||||||||
| 2019 Newfoundland and Labrador general election | ||||||||
|---|---|---|---|---|---|---|---|---|
| Party | Candidate | Votes | % | ±% | ||||
| Liberal | Lisa Dempster | 1,132 | 67.22 | -25.8 | ||||
| Progressive Conservative | Michael Normore | 552 | 32.78 | +29.6 | ||||
| Total valid votes | 1,684 | 100 | ||||||
| Total rejected ballots | 24 | |||||||
| Turnout | 1,708 | 58.8 | ||||||
| Eligible voters | 2,905 | |||||||
| Liberal hold | Swing | -27.71 | ||||||
| 2015 Newfoundland and Labrador general election | ||||||||
|---|---|---|---|---|---|---|---|---|
| Party | Candidate | Votes | % | ±% | ||||
| Liberal | Lisa Dempster | 1,405 | 93.05 | +39.48 | ||||
| New Democratic | Jennifer Deon | 57 | 3.77 | -29.20 | ||||
| Progressive Conservative | Jason MacKenzie | 48 | 3.18 | -10.29 | ||||
| Total valid votes | 1,510 | 99.60 | ||||||
| Total rejected ballots | 6 | 0.40 | ||||||
| Turnout | 1,516 | 49.48 | ||||||
| Eligible voters | 3,064 | |||||||
| Liberal hold | Swing | +34.34 | ||||||
| By-election, June 25, 2013 Resignation of Yvonne Jones | |||||
|---|---|---|---|---|---|
| Party | Candidate | Votes | % | +/- | |
| Liberal | Lisa Dempster | 1,142 | 53.56 | -24.24 | |
| NDP | Jason Spingle | 703 | 32.97 | +30.91 | |
| Progressive Conservative | Dennis Normore | 287 | 13.46 | -13.33 | |
| Liberal hold | Swing | -24.24 | |||
| Party | Candidate | Votes | % | ±% | |
|---|---|---|---|---|---|
| Liberal | Yvonne Jones | 1,516 | 71.14 | -1.74 | |
| Progressive Conservative | Glen Acreman | 571 | 26.79 | -0.33 | |
| NDP | Bill Cooper | 44 | 2.06 | ||
| Total valid votes | 2,131 | 100.0 | |||
| Difference | 945 | 44.35 | |||
| Total rejected ballots | 2 | 0.09 | |||
| Turnout | 2,133 | 67.87 | |||
| Liberal hold | Swing | -1.58 | |||
| Party | Candidate | Votes | % | ±% | |
|---|---|---|---|---|---|
| Liberal | Yvonne Jones | 1,736 | 72.88 | +12.90 | |
| Progressive Conservative | Dennis Normore | 646 | 27.12 | -4.73 | |
| Party | Candidate | Votes | % | ±% | |
|---|---|---|---|---|---|
| Liberal | Yvonne Jones | 1,514 | 59.98 | -25.47 | |
| Progressive Conservative | Dennis Normore | 804 | 31.85 | +17.30 | |
| Labrador Party | Frank Pye | 206 | 8.16 | +8.16 | |
| Party | Candidate | Votes | % | ±% | |
|---|---|---|---|---|---|
| Liberal | Yvonne Jones | 1,832 | 85.45 | +43.37 | |
| Progressive Conservative | Sharon Moores | 312 | 14.55 | +13.12 | |
| Party | Candidate | Votes | % | ±% | |
|---|---|---|---|---|---|
| Independent | Yvonne Jones | 1,665 | 56.83 | ||
| Liberal | Danny Dumaresque | 1,233 | 42.08 | ||
| Progressive Conservative | Berkley Bursey | 42 | 1.43 | – | |
Eagle River
| Party | Candidate | Votes | % | ±% | |
|---|---|---|---|---|---|
| Liberal | Danny Dumaresque | 1,578 | 66.95 | ||
| Progressive Conservative | Michael Kelly | 486 | 20.62 | – | |
| NDP | Jessie Bird | 293 | 12.43 | ||
| Party | Candidate | Votes | % | ±% | |
|---|---|---|---|---|---|
| Liberal | Danny Dumaresque | 1,540 | 60.02 | ||
| Progressive Conservative | Reginald Hancock | 1,026 | 39.98 | – | |
| Party | Candidate | Votes | % | ±% | |
|---|---|---|---|---|---|
| Liberal | Eugene Hiscock | 1,170 | 46.35 | ||
| Progressive Conservative | Stanley Pike | 782 | 30.98 | – | |
| NDP | Claude Rumbolt | 573 | 22.70 | ||
| Party | Candidate | Votes | % | ±% | |
|---|---|---|---|---|---|
| Liberal | Eugene Hiscock | 1,316 | 54.58 | ||
| NDP | Claude Rumbolt | 568 | 23.56 | ||
| Progressive Conservative | Philip Stone | 527 | 21.86 | – | |
| Party | Candidate | Votes | % | ±% | |
|---|---|---|---|---|---|
| Liberal | Eugene Hiscock | 865 | 51.00 | ||
| Progressive Conservative | Claude Rumbolt | 754 | 44.46 | – | |
| NDP | Elsie McDonald | 77 | 4.54 | ||
| Party | Candidate | Votes | % | ±% | |
|---|---|---|---|---|---|
| Liberal | Ian Strachan | 962 | 62.18 | ||
| Progressive Conservative | Churchill White | 585 | 37.82 | – | |
Labrador South
| Party | Candidate | Votes | % | ±% | |
|---|---|---|---|---|---|
| Labrador Party | Michael Martin | 1.047 | 50.65 | ||
| Liberal | Josiah Harvey | 899 | 43.05 | ||
| Progressive Conservative | Edward Kersey | 132 | 6.30 | – | |
| Party | Candidate | Votes | % | ±% | |
|---|---|---|---|---|---|
| Liberal | Josiah Harvey | 933 | 50.03 | ||
| Labrador Party | Michael Martin | 932 | 49.97 | ||
| Party | Candidate | Votes | % | ±% | |
|---|---|---|---|---|---|
| Liberal | Josiah Harvey | 890 | 47.52 | ||
| Labrador Party | Michael Martin | 807 | 43.09 | ||
| Progressive Conservative | Edward Kean | 176 | 9.40 | – | |
| Party | Candidate | Votes | % | ±% | |
|---|---|---|---|---|---|
| Liberal | Gerald I. Hill | 1,129 | 90.39 | ||
| Progressive Conservative | Leace Critch | 120 | 9.61 | – | |
| Party | Candidate | Votes | % | ±% | |
|---|---|---|---|---|---|
| Liberal | Gerald I. Hill | acc. | |||
| Party | Candidate | Votes | % | ±% | |
|---|---|---|---|---|---|
| Liberal | Gerald I. Hill | acc. | |||
| Party | Candidate | Votes | % | ±% | |
|---|---|---|---|---|---|
| Liberal | George Sellars | 1,061 | 90.84 | ||
| Progressive Conservative | Roderick Roberts | 107 | 9.16 | – | |
| Party | Candidate | Votes | % | ±% | |
|---|---|---|---|---|---|
| Liberal | George Sellars | acc. | |||
References
- "Summary of Polling Divisions CARTWRIGHT - L'ANSE AU CLAIR" (PDF). Elections Newfoundland and Labrador. 3 August 2011. Retrieved 15 September 2011.
External links
- Website of the Newfoundland and Labrador House of Assembly
- Newfoundland & Labrador Votes 2007
- Newfoundland & Labrador Votes 2003
| St. John's |  | |
|---|---|---|
| St. John's suburbs | ||
| Avalon Peninsula | ||
| Eastern Newfoundland | ||
| Central Newfoundland | ||
| Western Newfoundland | ||
| Labrador | ||