Mount Pearl North
Mount Pearl North, formerly known as Waterford Valley, is a provincial electoral district for the House of Assembly of Newfoundland and Labrador, Canada. As of 2011, there are 9,622 eligible voters living within the district.[2]
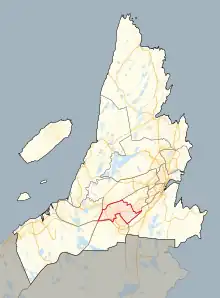 Location in the St. John's area | |||
| Coordinates: | 47.524°N 52.810°W | ||
| Provincial electoral district | |||
| Legislature | Newfoundland and Labrador House of Assembly | ||
| MHA |
Liberal | ||
| District created | 2006 | ||
| First contested | 2007 | ||
| Last contested | 2021 | ||
| Demographics | |||
| Population (2011) | 14,190[1] | ||
| Electors (2017) | 9,976 | ||
| Area (km²) | 15 | ||
| Census division(s) | Division No. 1 | ||
| Census subdivision(s) | Mount Pearl, St. John's | ||
This suburban district includes the northern part of the city of Mount Pearl and part of the city of St. John's. The district was created in 2007 using 79 per cent of the old Waterford Valley district and smaller sections of Mount Pearl and Topsail districts.[3] The district was reconfigured in 2015.
Members of the House of Assembly
The district has elected the following Members of the House of Assembly:
| Assembly | Years | Member | Party | |
|---|---|---|---|---|
| Before 1975: see St. John's North | ||||
| Waterford - Kenmount | ||||
| 37th | 1975–1979 | Gerry Ottenheimer | Progressive Conservative | |
| 38th | 1979–1982 | |||
| 39th | 1982–1985 | |||
| 40th | 1985–1987 | |||
| 1988-1989 | Eric Gullage | Liberal | ||
| 41st | 1989–1993 | |||
| 42nd | 1993–1996 | Harvey Hodder | Progressive Conservative | |
| Waterford | ||||
| 43rd | 1996–1999 | Harvey Hodder | Progressive Conservative | |
| 44th | 1999–2003 | |||
| 45th | 2003–2007 | |||
| Mount Pearl North | ||||
| 46th | 2007–2011 | Steve Kent | Progressive Conservative | |
| 47th | 2011–2015 | |||
| 48th | 2015–2017 | |||
| 2017–2019 | Jim Lester | |||
| 49th | 2019–2021 | |||
| 50th | 2021–Present | Lucy Stoyles | Liberal | |
Election results
Mount Pearl North
Graph of election results (minor parties that never got 2% of the vote or didn't run consistently are omitted)
| 2021 Newfoundland and Labrador general election | ||||||||
|---|---|---|---|---|---|---|---|---|
| Party | Candidate | Votes | % | ±% | ||||
| Liberal | Lucy Stoyles | 2,428 | 46.69 | +9.50 | ||||
| Progressive Conservative | Jim Lester | 2,319 | 44.60 | -4.64 | ||||
| New Democratic | Jennifer McCreath | 337 | 6.48 | +0.42 | ||||
| NL Alliance | William Neville | 116 | 2.23 | -5.27 | ||||
| Total valid votes | 5,200 | |||||||
| Total rejected ballots | ||||||||
| Turnout | ||||||||
| Eligible voters | ||||||||
| Liberal gain from Progressive Conservative | Swing | +7.07 | ||||||
Source(s)
"Officially Nominated Candidates General Election 2021" (PDF). Elections Newfoundland and Labrador. Retrieved 3 March 2021. "NL Election 2021 (Unofficial Results)". Retrieved 27 March 2021. | ||||||||
| 2019 Newfoundland and Labrador general election | ||||||||
|---|---|---|---|---|---|---|---|---|
| Party | Candidate | Votes | % | ±% | ||||
| Progressive Conservative | Jim Lester | 2,907 | 49.24 | +2.36 | ||||
| Liberal | Nicole Kieley | 2,196 | 37.20 | +11.54 | ||||
| NL Alliance | William Neville | 443 | 7.50 | |||||
| New Democratic | Carol Reade | 358 | 6.06 | -18.66 | ||||
| Total valid votes | 5,904 | 99.46 | ||||||
| Total rejected ballots | 32 | 0.54 | +0.15 | |||||
| Turnout | 5,936 | 57.88 | +14.65 | |||||
| Eligible voters | 10,255 | |||||||
| Progressive Conservative hold | Swing | -4.59 | ||||||
}
| Party | Candidate | Votes | % | ±% | |
|---|---|---|---|---|---|
| Progressive Conservative | Jim Lester | 2,064 | 46.89 | -4.59 | |
| Liberal | Jim Burton | 1,129 | 25.65 | -16.77 | |
| New Democratic | Nicole Kieley | 1,088 | 24.72 | +18.61 | |
| Independent | Hudson Stratton | 121 | 2.75 | ||
| Total valid votes | 4,402 | 99.62 | |||
| Total rejected and declined votes | 17 | 0.38 | |||
| Turnout | 4,419 | 44.30 | |||
| Electors on the lists | 9,976 | ||||
| Progressive Conservative hold | Swing | +6.09 | |||
| 2015 Newfoundland and Labrador general election | ||||||||
|---|---|---|---|---|---|---|---|---|
| Party | Candidate | Votes | % | ±% | ||||
| Progressive Conservative | Steve Kent | 3,120 | 51.48 | -21.38 | ||||
| Liberal | Randy Simms | 2,571 | 42.42 | +35.28 | ||||
| New Democratic | Cameron Mercer-Maillet | 370 | 6.10 | -13.45 | ||||
| Total valid votes | 6,061 | 99.51 | ||||||
| Turnout | 6,091 | 62.64 | ||||||
| Electors on the lists | 9,724 | |||||||
| Party | Candidate | Votes | % | ±% | |
|---|---|---|---|---|---|
| Progressive Conservative | Steve Kent | 3,727 | 73.31 | -11.74 | |
| New Democratic | Kurtis Coombs | 994 | 19.55 | +13.64 | |
| Liberal | Maurice Budgell | 363 | 7.14 | -1.90 | |
| Total valid votes | 5,084 | 99.24 | |||
| Total rejected and declined votes | 39 | 0.76 | +0.37 | ||
| Turnout | 5,123 | 51.93 | -9.43 | ||
| Electors on the lists | 9,865 | ||||
| 2007 Newfoundland and Labrador general election | ||||||||
|---|---|---|---|---|---|---|---|---|
| Party | Candidate | Votes | % | |||||
| Progressive Conservative | Steve Kent | 4,751 | 85.05 | |||||
| Liberal | Elaine Reid | 504 | 9.04 | |||||
| New Democratic | Janice Lockyer | 330 | 5.91 | |||||
| Total valid votes | 5,586 | 99.61 | ||||||
| Total rejected and declined votes | 22 | 0.39 | ||||||
| Turnout | 5,608 | 61.36 | ||||||
| Electors on the lists | 9,140 | |||||||
Waterford Valley
| 2003 Newfoundland and Labrador general election | ||||||||
|---|---|---|---|---|---|---|---|---|
| Party | Candidate | Votes | % | |||||
| Progressive Conservative | Harvey Hodder | 4,569 | 73.03 | |||||
| Liberal | Averill Baker | 1,277 | 20.41 | |||||
| New Democratic | Justin Locke | 410 | 6.55 | |||||
| Total valid votes | 6,256 | 99.87 | ||||||
| Total rejected and declines votes | 8 | 0.13 | ||||||
| Turnout | 6,264 | 66.81 | ||||||
| Electors on the lists | 9,376 | |||||||
| 1999 Newfoundland and Labrador general election | ||||||||
|---|---|---|---|---|---|---|---|---|
| Party | Candidate | Votes | % | |||||
| Progressive Conservative | Harvey Hodder | 3,480 | 54.38 | |||||
| Liberal | Paula M. Buckle | 2,680 | 41.88 | |||||
| New Democratic | Bill Maddigan | 239 | 3.73 | |||||
| Total valid votes | 6,399 | 99.84 | ||||||
| Total rejected and declines votes | 10 | 0.16 | ||||||
| Turnout | 6,409 | 74.90 | ||||||
| Electors on the lists | 8,557 | |||||||
| 1996 Newfoundland and Labrador general election | ||||||||
|---|---|---|---|---|---|---|---|---|
| Party | Candidate | Votes | % | |||||
| Progressive Conservative | Harvey Hodder | 3,444 | 54.365 | |||||
| Liberal | Barrie Heywood | 2,858 | 45.35 | |||||
| Total valid votes | 6,302 | 99.68 | ||||||
| Total rejected and declines votes | 20 | 0.32 | ||||||
| Turnout | 6,322 | 73.88 | ||||||
| Electors on the lists | 8,557 | |||||||
Waterford-Kenmount
| 1993 Newfoundland and Labrador general election | ||||||||
|---|---|---|---|---|---|---|---|---|
| Party | Candidate | Votes | % | |||||
| Progressive Conservative | Harvey Hodder | 4,731 | 51.31 | |||||
| Liberal | Eric Gullage | 3,837 | 41.61 | |||||
| New Democratic | Scott Anderson | 653 | 7.08 | |||||
| Total valid votes | 9,221 | 99.72 | ||||||
| Total rejected and declines votes | 26 | 0.28 | ||||||
| Turnout | 9,247 | 98.78 | ||||||
| Electors on the lists | 9,361 | |||||||
| 1989 Newfoundland and Labrador general election | ||||||||
|---|---|---|---|---|---|---|---|---|
| Party | Candidate | Votes | % | |||||
| Liberal | Eric Gullage | 3,947 | 53.06 | |||||
| Progressive Conservative | Ralph Tucker | 3,188 | 42.86 | |||||
| New Democratic | Wayne James | 304 | 4.09 | |||||
| Total valid votes | 7,439 | 99.85 | ||||||
| Total rejected and declines votes | 11 | 0.15 | ||||||
| Turnout | 7,450 | 79.59 | ||||||
| Electors on the lists | 9,361 | |||||||
| Newfoundland and Labrador provincial by-election, 9 March 1988 Appointment of Gerry Ottenheimer to the Senate | ||||||||
|---|---|---|---|---|---|---|---|---|
| Party | Candidate | Votes | % | |||||
| Liberal | Eric Gullage | 2,311 | 41.45 | |||||
| Progressive Conservative | E. Ralph Tucker | 2,111 | 37.86 | |||||
| New Democratic | Cle Newhook | 1,154 | 20.70 | |||||
| Total valid votes | 5,576 | 99.86 | ||||||
| Total rejected and declines votes | 8 | 0.14 | ||||||
| Turnout | 5,584 | 69.03 | ||||||
| Electors on the lists | 8,089 | |||||||
| 1985 Newfoundland and Labrador general election | ||||||||
|---|---|---|---|---|---|---|---|---|
| Party | Candidate | Votes | % | |||||
| Progressive Conservative | Gerry Ottenheimer | 3,251 | 56.98 | |||||
| Liberal | Eric Adams | 1,401 | 24.55 | |||||
| New Democratic | Wallace Day | 1,054 | 18.47 | |||||
| Total valid votes | 5,706 | 99.84 | ||||||
| Total rejected and declines votes | 9 | 0.16 | ||||||
| Turnout | 5,715 | 70.65 | ||||||
| Electors on the lists | 8,089 | |||||||
References
- http://www.nledbc.ca/finaldesc/mountpearl_north.pdf
- "Summary of Polling Divisions Mount Pearl North" (PDF). Elections Newfoundland and Labrador. 3 August 2011. Retrieved 2 September 2011.
- CBC news NL votes 2007 district profiles
- Elections Newfoundland and Labrador
External links
- Website of the Newfoundland and Labrador House of Assembly
- Map of Mount Pearl North riding as of 2015
| St. John's |  | |
|---|---|---|
| St. John's suburbs | ||
| Avalon Peninsula | ||
| Eastern Newfoundland | ||
| Central Newfoundland | ||
| Western Newfoundland | ||
| Labrador | ||
This article is issued from Wikipedia. The text is licensed under Creative Commons - Attribution - Sharealike. Additional terms may apply for the media files.