Chaoyang District, Shantou
Chaoyang District (postal: Chaoyang; simplified Chinese: 潮阳区; traditional Chinese: 潮陽區; pinyin: Cháoyáng Qū) is a district in the municipality of Shantou, Guangdong Province, China.
Chaoyang
潮阳区 | |
|---|---|
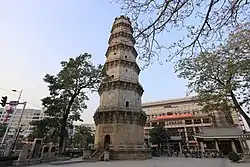 Chaoyang Wenguang Pagoda | |
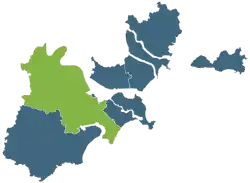 Location of Chaoyang in Shantou | |
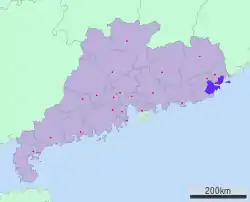 Shantou in Guangdong | |
| Coordinates: 23°15′57″N 116°36′05″E | |
| Country | People's Republic of China |
| Province | Guangdong |
| Prefecture-level city | Shantou |
| Area | |
| • Total | 667.6 km2 (257.8 sq mi) |
| Time zone | UTC+8 (China Standard) |
Administration
Population figures given as of the 2003 census.
Subdistricts (街道, jiedao)
- Wenguang (文光) - pop. 146649
- Mianbei (棉北) - pop. 54942
- Chengnan (城南) - pop. 108651
- Jinpu (金浦) - pop. 79252
Famous natives
- Chin Sophonpanich, founder of Bangkok Bank
- Cai Chusheng (1906–1968), film director
- Huang Guangyu, Chinese billionaire
- Rocky Cheng Kin Lok (鄭健樂), maturity winner of the Mr. Hong Kong contest in 2005
Climate
| Climate data for Chaoyang (1991–2020 normals, extremes 1981–2010) | |||||||||||||
|---|---|---|---|---|---|---|---|---|---|---|---|---|---|
| Month | Jan | Feb | Mar | Apr | May | Jun | Jul | Aug | Sep | Oct | Nov | Dec | Year |
| Record high °C (°F) | 28.7 (83.7) |
29.9 (85.8) |
30.7 (87.3) |
33.1 (91.6) |
35.5 (95.9) |
36.7 (98.1) |
38.7 (101.7) |
37.3 (99.1) |
37.1 (98.8) |
34.1 (93.4) |
32.1 (89.8) |
29.3 (84.7) |
38.7 (101.7) |
| Average high °C (°F) | 19.1 (66.4) |
19.5 (67.1) |
21.7 (71.1) |
25.5 (77.9) |
28.7 (83.7) |
30.9 (87.6) |
32.5 (90.5) |
32.3 (90.1) |
31.6 (88.9) |
29.0 (84.2) |
25.4 (77.7) |
21.1 (70.0) |
26.4 (79.6) |
| Daily mean °C (°F) | 15.1 (59.2) |
15.6 (60.1) |
17.9 (64.2) |
21.8 (71.2) |
25.4 (77.7) |
27.9 (82.2) |
29.2 (84.6) |
28.9 (84.0) |
28.0 (82.4) |
25.2 (77.4) |
21.4 (70.5) |
17.1 (62.8) |
22.8 (73.0) |
| Average low °C (°F) | 12.5 (54.5) |
13.2 (55.8) |
15.4 (59.7) |
19.3 (66.7) |
23.1 (73.6) |
25.7 (78.3) |
26.6 (79.9) |
26.4 (79.5) |
25.5 (77.9) |
22.5 (72.5) |
18.6 (65.5) |
14.3 (57.7) |
20.3 (68.5) |
| Record low °C (°F) | 2.5 (36.5) |
4.8 (40.6) |
4.1 (39.4) |
9.3 (48.7) |
15.5 (59.9) |
18.6 (65.5) |
21.7 (71.1) |
22.2 (72.0) |
18.2 (64.8) |
11.6 (52.9) |
7.2 (45.0) |
1.6 (34.9) |
1.6 (34.9) |
| Average precipitation mm (inches) | 37.5 (1.48) |
46.6 (1.83) |
82.4 (3.24) |
156.6 (6.17) |
219.1 (8.63) |
304.2 (11.98) |
238.7 (9.40) |
311.8 (12.28) |
145.2 (5.72) |
36.1 (1.42) |
48.1 (1.89) |
41.4 (1.63) |
1,667.7 (65.67) |
| Average precipitation days (≥ 0.1 mm) | 6.2 | 8.6 | 10.6 | 12.0 | 14.1 | 16.7 | 14.2 | 14.8 | 9.3 | 4.1 | 4.5 | 6.2 | 121.3 |
| Average relative humidity (%) | 72 | 76 | 77 | 79 | 81 | 83 | 80 | 80 | 75 | 68 | 71 | 70 | 76 |
| Mean monthly sunshine hours | 155.6 | 118.9 | 117.8 | 132.7 | 156.6 | 174.4 | 239.9 | 221.7 | 215.2 | 226.0 | 186.7 | 170.8 | 2,116.3 |
| Percent possible sunshine | 46 | 37 | 31 | 35 | 38 | 43 | 58 | 56 | 59 | 63 | 57 | 52 | 48 |
| Source: China Meteorological Administration[1][2] | |||||||||||||
References
- 中国气象数据网 – WeatherBk Data (in Simplified Chinese). China Meteorological Administration. Retrieved 28 May 2023.
- 中国气象数据网 (in Simplified Chinese). China Meteorological Administration. Retrieved 28 May 2023.
External links
Wikimedia Commons has media related to Chaoyang District, Shantou.
| Sub-provincial cities |
| ||||||||||||||||||||||||||||||||||||||||||||||||||||||||||||||||||||
|---|---|---|---|---|---|---|---|---|---|---|---|---|---|---|---|---|---|---|---|---|---|---|---|---|---|---|---|---|---|---|---|---|---|---|---|---|---|---|---|---|---|---|---|---|---|---|---|---|---|---|---|---|---|---|---|---|---|---|---|---|---|---|---|---|---|---|---|---|---|
| Prefecture-level cities |
| ||||||||||||||||||||||||||||||||||||||||||||||||||||||||||||||||||||
This article is issued from Wikipedia. The text is licensed under Creative Commons - Attribution - Sharealike. Additional terms may apply for the media files.