Charleswood—St. James—Assiniboia—Headingley
Charleswood—St. James—Assiniboia—Headingley (formerly known as Charleswood—Assiniboine and Charleswood—St. James—Assiniboia) is a federal electoral district in Manitoba, Canada, that has been represented in the House of Commons of Canada since 1997.
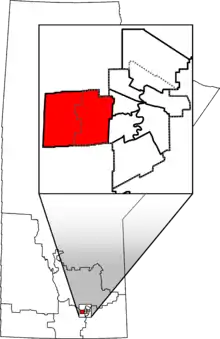 Charleswood—St. James—Assiniboia—Headingley in relation to other Manitoba federal electoral districts as of the 2013 Representation Order. Dotted line shows Winnipeg city limits. | |||
| Federal electoral district | |||
| Legislature | House of Commons | ||
| MP |
Conservative | ||
| District created | 1996 | ||
| First contested | 1997 | ||
| Last contested | 2021 | ||
| District webpage | profile, map | ||
| Demographics | |||
| Population (2021)[1] | 84,767 | ||
| Electors (2021) | 65,423 | ||
| Area (km²)[2] | 204.85 | ||
| Pop. density (per km²) | 413.8 | ||
| Census division(s) | Division No. 11 | ||
| Census subdivision(s) | Winnipeg, Headingley | ||
Demographics
- According to the 2021 Canadian census[3]
Ethnic groups: 75.4% White, 11.3% Indigenous, 4.2% Filipino, 2.4% South Asian, 2.1% Black, 1.1% Chinese
Languages: 83% English, 2.1% Tagalog, 1.5% French, 1.3% German, 1.1 Russian
Religions (2021): 52.2% Christian (19.1% Catholic, 7.9% United Church, 4.8% Anglican, 2.9% Lutheran, 1.6% Christian Orthodox, 1.3% Anabaptist, 1.2% Baptist), 42.6% No religion, 1.3% Muslim, 1.2% Jewish, 1% Sikh
Median income (2020): $46,000
Average income (2020): $57,050
| Panethnic group | 2021[4] | 2016[5] | 2011[6] | |||||||||||
|---|---|---|---|---|---|---|---|---|---|---|---|---|---|---|
| Pop. | % | Pop. | % | Pop. | % | |||||||||
| European[lower-alpha 1] | 62,090 | 75.46% | 64,190 | 80% | 67,785 | 85.14% | ||||||||
| Indigenous | 9,285 | 11.28% | 7,880 | 9.82% | 6,105 | 7.67% | ||||||||
| Southeast Asian[lower-alpha 2] | 3,875 | 4.71% | 2,870 | 3.58% | 1,200 | 1.51% | ||||||||
| South Asian | 1,985 | 2.41% | 1,400 | 1.74% | 1,120 | 1.41% | ||||||||
| African | 1,740 | 2.11% | 1,380 | 1.72% | 1,380 | 1.73% | ||||||||
| East Asian[lower-alpha 3] | 1,405 | 1.71% | 1,165 | 1.45% | 1,170 | 1.47% | ||||||||
| Middle Eastern[lower-alpha 4] | 650 | 0.79% | 430 | 0.54% | 265 | 0.33% | ||||||||
| Latin American | 575 | 0.7% | 455 | 0.57% | 300 | 0.38% | ||||||||
| Other/multiracial[lower-alpha 5] | 665 | 0.81% | 470 | 0.59% | 290 | 0.36% | ||||||||
| Total responses | 82,280 | 97.07% | 80,240 | 97.17% | 79,615 | 97.25% | ||||||||
| Total population | 84,767 | 100% | 82,574 | 100% | 81,864 | 100% | ||||||||
| Notes: Totals greater than 100% due to multiple origin responses. Demographics based on 2012 Canadian federal electoral redistribution riding boundaries. | ||||||||||||||
History
In 1996, it was created as "Charleswood—Assiniboine" from Winnipeg—St. James riding.
In 1998, it was renamed "Charleswood—St. James—Assiniboia".
In 2003, it was abolished, but the entire district was transferred to "Charleswood—St. James", and small parts of Winnipeg Centre and Winnipeg South Centre were added.
In 2004, it was renamed "Charleswood—St. James—Assiniboia".
In 2015, it was renamed Charleswood—St. James—Assiniboia—Headingley but there was no boundary changes following the 2012 Canadian federal electoral redistribution.
Members of Parliament
| Parliament | Years | Member | Party | |
|---|---|---|---|---|
| Charleswood—Assiniboine Riding created from Winnipeg—St. James and Winnipeg South |
||||
| 36th | 1997–2000 | John Harvard | Liberal | |
| Charleswood—St. James—Assiniboia | ||||
| 37th | 2000–2004 | John Harvard | Liberal | |
| Charleswood—St. James | ||||
| 38th | 2004–2006 | Steven Fletcher | Conservative | |
| Charleswood—St. James—Assiniboia | ||||
| 39th | 2006–2008 | Steven Fletcher | Conservative | |
| 40th | 2008–2011 | |||
| 41st | 2011–2015 | |||
| Charleswood—St. James—Assiniboia—Headingley | ||||
| 42nd | 2015–2019 | Doug Eyolfson | Liberal | |
| 43rd | 2019–2021 | Marty Morantz | Conservative | |
| 44th | 2021–present | |||
Current Member of Parliament
Its Member of Parliament is Marty Morantz. He was first elected in 2019. He is a member of the Conservative Party of Canada
Election results
Charleswood—St. James—Assiniboia—Headingley, 2015–present
| 2021 Canadian federal election | ||||||||
|---|---|---|---|---|---|---|---|---|
| Party | Candidate | Votes | % | ±% | Expenditures | |||
| Conservative | Marty Morantz | 18,111 | 40.0 | -0.7 | $97,370.69 | |||
| Liberal | Doug Eyolfson | 17,651 | 39.0 | +3.5 | $79,799.09 | |||
| New Democratic | Madelaine Dwyer | 6,974 | 15.4 | +1.2 | $0.00 | |||
| People's | Angela Van Hussen | 1,594 | 3.5 | -0.8 | $417.99 | |||
| Green | Vanessa Parks | 947 | 2.1 | -2.6 | $0.00 | |||
| Total valid votes/Expense limit | 45,277 | 99.4 | – | $104,740.13 | ||||
| Total rejected ballots | 296 | 0.6 | ||||||
| Turnout | 45,573 | 69.7 | ||||||
| Eligible voters | 65,423 | |||||||
| Conservative hold | Swing | -2.1 | ||||||
| Source: Elections Canada[7] | ||||||||
| 2019 Canadian federal election | ||||||||
|---|---|---|---|---|---|---|---|---|
| Party | Candidate | Votes | % | ±% | Expenditures | |||
| Conservative | Marty Morantz | 18,815 | 40.7 | +1.66 | $96,689.75 | |||
| Liberal | Doug Eyolfson | 16,398 | 35.5 | -16.52 | $75,789.03 | |||
| New Democratic | Ken St. George | 6,556 | 14.2 | +8.17 | none listed | |||
| Green | Kristin Lauhn-Jensen | 2,178 | 4.7 | +1.78 | $0.00 | |||
| People's | Steven Fletcher | 1,975 | 4.3 | – | none listed | |||
| Christian Heritage | Melissa Penner | 166 | 0.4 | – | none listed | |||
| Independent | Brian Ho | 140 | 0.3 | – | none listed | |||
| Total valid votes/expense limit | 46,228 | 100.0 | ||||||
| Total rejected ballots | 256 | |||||||
| Turnout | 46,484 | 71.1 | ||||||
| Eligible voters | 65,375 | |||||||
| Conservative gain from Liberal | Swing | +9.13 | ||||||
| Source: Elections Canada[8][9] | ||||||||
| 2015 Canadian federal election | ||||||||
|---|---|---|---|---|---|---|---|---|
| Party | Candidate | Votes | % | ±% | Expenditures | |||
| Liberal | Doug Eyolfson | 24,531 | 52.02 | +33.63 | – | |||
| Conservative | Steven Fletcher | 18,408 | 39.04 | -18.52 | – | |||
| New Democratic | Tom Paulley | 2,842 | 6.03 | -14.10 | – | |||
| Green | Kevin Nichols | 1,376 | 2.92 | -1.01 | – | |||
| Total valid votes/Expense limit | 47,157 | 99.59 | $197,421.64 | |||||
| Total rejected ballots | 195 | 0.41 | – | |||||
| Turnout | 47,352 | 74.61 | – | |||||
| Eligible voters | 63,466 | |||||||
| Liberal gain from Conservative | Swing | +26.08 | ||||||
| Source: Elections Canada[10][11] | ||||||||
Charleswood—St. James—Assiniboia, 2004–2015
| 2011 Canadian federal election | ||||||||
|---|---|---|---|---|---|---|---|---|
| Party | Candidate | Votes | % | ±% | Expenditures | |||
| Conservative | Steven Fletcher | 23,264 | 57.56 | +3.73 | – | |||
| New Democratic | Tom Paulley | 8,134 | 20.12 | +2.20 | – | |||
| Liberal | Rob Clement | 7,433 | 18.39 | -2.84 | – | |||
| Green | Denali Enns | 1,587 | 3.93 | -2.64 | – | |||
| Total valid votes/Expense limit | 40,418 | 99.67 | – | |||||
| Total rejected ballots | 135 | 0.33 | -0.01 | |||||
| Turnout | 40,553 | 64.77 | +1.41 | |||||
| Eligible voters | 62,609 | – | – | |||||
| Conservative hold | Swing | +0.77 | ||||||
| 2008 Canadian federal election | ||||||||
|---|---|---|---|---|---|---|---|---|
| Party | Candidate | Votes | % | ±% | Expenditures | |||
| Conservative | Steven Fletcher | 21,588 | 53.83 | +6.86 | $69,196 | |||
| Liberal | Bob Friesen | 8,514 | 21.22 | -15.15 | $32,010 | |||
| New Democratic | Fiona Shiells | 7,190 | 17.92 | +5.12 | $14,322 | |||
| Green | Brian Timlick | 2,632 | 6.56 | +2.72 | $2,383 | |||
| Christian Heritage | Mark Price | 180 | 0.44 | – | – | |||
| Total valid votes/Expense limit | 40,104 | 100.00 | $78,841 | |||||
| Total rejected ballots | 136 | 0.34 | -0.01 | |||||
| Turnout | 40,240 | 63.36 | -6.03 | |||||
| 2006 Canadian federal election | ||||||||
|---|---|---|---|---|---|---|---|---|
| Party | Candidate | Votes | % | ±% | Expenditures | |||
| Conservative | Steven Fletcher | 20,791 | 46.97 | +2.7 | $71,903 | |||
| Liberal | John Loewen | 16,099 | 36.37 | -6.2 | $68,104 | |||
| New Democratic | Dennis Kshyk | 5,669 | 12.80 | +2.7 | $1,977 | |||
| Green | Michael Johannson | 1,700 | 3.84 | +1.7 | $397.50 | |||
| Total valid votes | 44,259 | 100.00 | – | |||||
| Total rejected ballots | 157 | 0.35 | +0.1 | |||||
| Turnout | 44,416 | 69.39 | +3.9 | |||||
Charleswood—St. James, 2003–2004
| 2004 Canadian federal election | ||||||||
|---|---|---|---|---|---|---|---|---|
| Party | Candidate | Votes | % | ±% | Expenditures | |||
| Conservative | Steven Fletcher | 18,688 | 44.3 | -11.9 | $71,182 | |||
| Liberal | Glen Murray | 17,954 | 42.6 | +6.3 | $71,685 | |||
| New Democratic | Peter Carney | 4,283 | 10.2 | +2.9 | $6,030 | |||
| Green | Andrew Basham | 880 | 2.1 | – | $1,061 | |||
| Marijuana | Dan Zupansky | 337 | 0.8 | – | – | |||
| Communist | Beatriz Alas | 49 | 0.1 | -0.2 | $654 | |||
| Total valid votes | 42,191 | 100.0 | – | |||||
| Total rejected ballots | 109 | 0.3 | 0.0 | |||||
| Turnout | 42,300 | 65.5 | -1.6 | |||||
Note: Conservative vote is compared to the total of the Canadian Alliance vote and Progressive Conservative vote in 2000 election.
Charleswood St. James—Assiniboia, 1998–2003
| 2000 Canadian federal election | ||||||||
|---|---|---|---|---|---|---|---|---|
| Party | Candidate | Votes | % | ±% | Expenditures | |||
| Liberal | John Harvard | 13,901 | 36.2 | -6.8 | $56,399 | |||
| Alliance | Cyril McFate | 11,569 | 30.1 | +7.5 | $51,131 | |||
| Progressive Conservative | Curtis Moore | 9,991 | 26.0 | +2.7 | $18,126 | |||
| New Democratic | Dennis Kshyk | 2,786 | 7.3 | -3.3 | $1,741 | |||
| Communist | Greg Crowe | 138 | 0.4 | – | $287 | |||
| Total valid votes | 38,385 | 100.0 | – | |||||
| Total rejected ballots | 89 | 0.2 | -0.1 | |||||
| Turnout | 38,474 | 67.0 | -0.6 | |||||
Note: Canadian Alliance vote is compared to the Reform vote in 1997 election.
Charleswood—Assiniboine, 1996–1998
| 1997 Canadian federal election: Charleswood—Assiniboine | ||||||||
|---|---|---|---|---|---|---|---|---|
| Party | Candidate | Votes | % | Expenditures | ||||
| Liberal | John Harvard | 15,925 | 43.0 | $37,585 | ||||
| Progressive Conservative | Felix Holtmann | 8,664 | 23.4 | $51,089 | ||||
| Reform | Cyril McFate | 8,398 | 22.7 | $21,501 | ||||
| New Democratic | Rupert Forde | 3,923 | 10.6 | $1,850 | ||||
| Marxist–Leninist | Mary Stanley | 154 | 0.4 | $11 | ||||
| Total valid votes | 37,064 | 100.0 | ||||||
| Total rejected ballots | 262 | 0.4 | ||||||
| Turnout | 37,326 | 67.6 | ||||||
| History of Federal Ridings since 1867: CHARLESWOOD--ASSINIBOINE, Manitoba (1996 - 1998), Library of Parliament, Parliament of Canada. Retrieved 26 January 2010. | ||||||||
See also
References
- "Charleswood—St. James—Assiniboia—Headingley (Code 46002) Census Profile". 2011 census. Government of Canada - Statistics Canada. Retrieved March 3, 2011.
- Riding history for Charleswood–Assiniboine (1996–1998) from the Library of Parliament
- Riding history for Charleswood St. James–Assiniboia (1998–2003) from the Library of Parliament
- Riding history for Charleswood–St. James (2003–2004) from the Library of Parliament
- Riding history for Charleswood–St. James–Assiniboia (2004– ) from the Library of Parliament
- Expenditures - 2008
- Expenditures - 2004
- Expenditures - 2000
- Expenditures - 1997
Notes
- Statistic includes all persons that did not make up part of a visible minority or an indigenous identity.
- Statistic includes total responses of "Filipino" and "Southeast Asian" under visible minority section on census.
- Statistic includes total responses of "Chinese", "Korean", and "Japanese" under visible minority section on census.
- Statistic includes total responses of "West Asian" and "Arab" under visible minority section on census.
- Statistic includes total responses of "Visible minority, n.i.e." and "Multiple visible minorities" under visible minority section on census.
- Statistics Canada: 2022
- Statistics Canada: 2022
- "Profile table, Census Profile, 2021 Census of Population - Charleswood--St. James--Assiniboia--Headingley [Federal electoral district (2013 Representation Order)], Manitoba". February 9, 2022.
- Government of Canada, Statistics Canada (October 26, 2022). "Census Profile, 2021 Census of Population". www12.statcan.gc.ca. Retrieved October 22, 2023.
- Government of Canada, Statistics Canada (October 27, 2021). "Census Profile, 2016 Census". www12.statcan.gc.ca. Retrieved October 22, 2023.
- Government of Canada, Statistics Canada (November 27, 2015). "NHS Profile". www12.statcan.gc.ca. Retrieved October 22, 2023.
- "List of confirmed candidates – September 20, 2021 Federal Election". Elections Canada. Retrieved September 2, 2021.
- "List of confirmed candidates". Elections Canada. Retrieved October 4, 2019.
- "Election Night Results". Elections Canada. Retrieved November 9, 2019.
- Elections Canada – Confirmed candidates for Charleswood—St. James—Assiniboia—Headingley, 30 September 2015
- Elections Canada – Preliminary Election Expenses Limits for Candidates Archived August 15, 2015, at the Wayback Machine