Carbon footprint
The carbon footprint (or greenhouse gas footprint) serves as an indicator to compare the total amount of greenhouse gases emitted from an activity, product, company or country. Carbon footprints are usually reported in tons of emissions (CO2-equivalent) per unit of comparison; such as per year, person, kg protein, km travelled and alike. For a product, its carbon footprint includes the emissions for the entire life cycle from the production along the supply chain to its final consumption and disposal. Similarly for an organization, its carbon footprint includes the direct as well as the indirect emissions caused by the organization (called Scope 1, 2 and 3 in the Greenhouse Gas Protocol that is used for carbon accounting of organizations). Several methodologies and online tools exist to calculate the carbon footprint, depending on whether the focus is on a country, organization, product or individual person. For example, the carbon footprint of a product could help consumers decide which product to buy if they want to be climate aware. In the context of climate change mitigation activities, the carbon footprint can help distinguish those economic activities with a high footprint from those with a low footprint. In other words, the carbon footprint concept allows everyone to make comparisons between the climate-relevant impacts of individuals, products, companies, countries. In doing so, it helps to devise strategies and priorities for reducing the carbon footprint.

| Part of a series on |
| Climate change and society |
|---|
The carbon footprint is commonly expressed as the carbon dioxide equivalent (CO2eq) per unit of comparison. It sums up the total greenhouse gas emissions (not just carbon dioxide) caused by economic activities, events, organizations, services etc.[2] In other definitions, only the carbon dioxide emissions are taken into account but not those of other greenhouse gases, such as methane and nitrous oxide.[3]
To calculate the carbon footprint for different entities, the following methods are used: For organizations, the Greenhouse Gas Protocol is commonly used. It includes three carbon emission scopes (the direct carbon emissions, called Scope 1) and the indirect carbon emissions (Scope 2 and 3). The difference between Scope 2 and 3 is that Scope 3 emissions are those indirect emissions that are derived from the activities of an organization but that stem from sources which they do not own or control.[4] For whole countries, consumption-based emissions accounting can be used to calculate their carbon footprint for a given year. This approach is based on input-output analysis. For example, analysis of global supply chains is possible using consumption-based accounting through input-output analysis assisted by using today's super-computing capacity.[5] In contrast, countries also prepare national GHG inventories for the UNFCCC.[6][7] The GHG emissions listed in those national inventories are only from activities in the country itself (called territorial-based accounting or production-based accounting). They do not take into account of production of goods and services (that may be imported) on behalf of residents, which would be called consumption-based accounting.
A strength of comprehensive carbon footprint reporting (including Scope 3 emissions) is that it does away with loopholes of current systems: International transport is currently not included in countries' GHG inventories for the UNFCCC.[8] Under comprehensive carbon footprint reporting (also called consumption-based carbon accounting), emissions are relegated to final demand, namely to those that consume the goods and services.[9]
Definition
A commonly used definition of carbon footprint is as follows: "A measure of the total amount of carbon dioxide (CO2) and methane (CH4) emissions of a defined population, system or activity, considering all relevant sources, sinks and storage within the spatial and temporal boundary of the population, system or activity of interest. Calculated as carbon dioxide equivalent using the relevant 100-year global warming potential (GWP100)."[10] Carbon footprints are usually reported in tons of emissions (CO2-equivalent) per year.
Carbon footprints are usually reported in tons of emissions (CO2-equivalent) per unit of comparison; such as per year, person (also called per capita), kg protein (when comparing meat products), km travelled and alike.
In the definition of carbon footprint, some scientists include only CO2, but more commonly several of the important greenhouse gases are included. The various greenhouse gases are made comparable by using carbon dioxide equivalents over a relevant time scale, like 100 years. Some organizations use the term greenhouse gas footprint or climate footprint[11] to emphasize that all greenhouse gases are included, not just carbon dioxide.
The Greenhouse Gas Protocol also includes all of the most important greenhouse gases: "The standard covers the accounting and reporting of seven greenhouse gases covered by the Kyoto Protocol – carbon dioxide (CO2), methane (CH4), nitrous oxide (N2O), hydrofluorocarbons (HFCs), perfluorocarbons (PCFs), sulfur hexafluoride (SF6) and nitrogen trifluoride (NF3)."[12]
In comparison, the IPCC in 2022 uses a definition for carbon footprint which only includes carbon dioxide: The carbon footprint is defined there as the "measure of the exclusive total amount of emissions of carbon dioxide (CO2) that is directly and indirectly caused by an activity or is accumulated over the lifecycle stages of a product."[3]: 1796 The IPCC report's authors adopted the same definition that had been proposed in 2007 in the UK.[13] In that publication, only carbon dioxide was included in the definition of carbon footprint, with the justification that other greenhouse gases were more difficult to quantify (due to their differing global warming potentials). They had also stated that an inclusion of all greenhouse gases would make the carbon footprint indicator less practical.[13] One disadvantage of not including methane in the analysis is that some products or sectors that have a high methane footprint (for example livestock)[14] would appear better, less harmful for the climate, than they actually are.
Types of greenhouse gas emissions
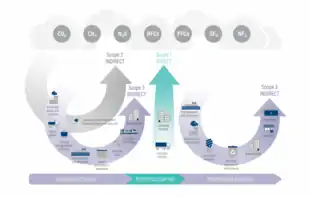
The greenhouse gas protocol is a set of standards for tracking greenhouse gas emissions.[17] The standards divide emissions into three scopes (Scope 1, 2 and 3) within the value chain.[18] Those greenhouse gas emissions caused directly by the organization/company itself (e.g. by burning fossil fuels) are referred to as Scope 1. The emissions caused indirectly by an organization, e.g. by purchasing secondary energy sources (e.g. electricity, heat, cooling or steam) and the associated emissions are called Scope 2. Lastly, the indirect emissions associated with upstream or downstream processes are called Scope 3.
Direct carbon emissions (Scope 1)
Direct or Scope 1 carbon emissions come from sources that are directly from the site that is producing a product or delivering a service.[19][20] An example for industry would be the emissions related to burning a fuel on site. On the individual level, emissions from personal vehicles or gas burning stoves would fall under Scope 1.
Indirect carbon emissions (Scope 2 and 3)
Indirect carbon emissions are emissions from sources upstream or downstream from the process being studied, also known as Scope 2 or Scope 3 emissions.[19]
Scope 2 emissions are the indirect emissions related to purchasing electricity, heat, and/or steam used on site.[20] Examples of upstream, indirect carbon emissions may include: Transportation of materials/fuels, any energy used outside of the production facility, wastes produced outside of the production facility.[21] Examples of downstream, indirect carbon emissions may include: Any end-of-life process or treatments, product and waste transportation, emissions associated with selling the product.[22] The GHG Protocol stipulates calculating upstream as well as downstream emissions. There could be some double counting because upstream emissions of one person's consumption patterns could be someone else's downstream emissions
Scope 3 emissions are all other indirect emissions derived from the activities of an organization but from sources which they do not own or control.[4] The GHG Protocol's Corporate Value Chain (Scope 3) Accounting and Reporting Standard allows companies to assess their entire value chain emissions impact and identify where to focus reduction activities.[23]
Scope 3 emission sources include emissions from suppliers and product users (also known as the value chain). Transportation of goods, and other indirect emissions are also part of this scope.[16] In 2022 about 30% of US companies reported Scope 3 emissions.[24] The International Sustainability Standards Board is developing a recommendation that Scope 3 emissions be included as part of all GHG reporting.[25]
Purpose and strengths

The current rise in global average temperature is more rapid than previous changes, and is primarily caused by humans who are burning fossil fuels.[27][28] Additional contributions to increasing greenhouse gases in the atmosphere include deforestation as well as agricultural and industrial practices, for example cement production. The two most notable greenhouse gases are carbon dioxide and methane.[29] Greenhouse gas emissions, and hence humanity's carbon footprint has been increasing during the 21st century.[30] The Paris Agreement states that greenhouse gas emissions must be reduced enough so that the global temperature increase is preferably no more than 1.5°C above pre-industrial levels.[31][32]
The carbon footprint concept allows comparisons between the climate-relevant impacts of individuals, products, companies, countries etc. A carbon footprint label on products could enable consumers to choose those products with a lower carbon footprint if they wanted to contribute to climate change mitigation efforts. For example in the context of meat products, such a label could make it clear that beef has a higher carbon footprint than chicken.[1]
Once the magnitude of the carbon footprint of an organization is known, a strategy can be devised to reduce it. For example, for most businesses the vast majority of emissions do not come from Scope 1 (on site) or Scope 2 (energy supplied directly to the company) activities but from Scope 3 emissions: They come from the extended upstream and downstream supply chain.[33][34] Therefore, if one ignores the Scope 3 emissions, not all emissions of importance will be detected thus limiting mitigation activities.[35] For large companies (e.g. clothing and automobile) to fully report their carbon footprints would require examination of more than 100,000 supply chain pathways.[36]
The importance of displacement of carbon emissions – also referred to as carbon leakage – has been known for some years.[37] The carbon footprint addresses concerns of carbon leakage unlike the Paris Agreement which does not identify this. Carbon leakage occurs when importing countries (often rich countries) outsource production to exporting countries (often low-income countries).[38] The displacement of impacts is typically from developed to developing countries.[37] For example, countries can make it look like their GHG emissions are reducing by moving dirty industries (those that emit a lot of greenhouse gases) abroad, but when you look at their emissions from a consumption perspective they could be increasing not decreasing.[39][40]
Carbon leakage and the related international trade has a range of environmental impacts such as increased air pollution,[41] water scarcity,[42] biodiversity loss,[43] raw material usage,[44] and energy depletion.[45]
Scholars have argued that consumption-based accounting (including all Scope 3 emissions) should be used in addition with production-based for shared producer and consumer responsibility.[46] For example, currently countries report on their annual GHG inventory to UNFCCC based on their territorial emissions (also called territorial-based approach or production-based approach).[7][6] However, it would be beneficial to include consumption-based calculations in the requirements to close loopholes (e.g. to address the challenge of carbon leakage).[41]
Another example is that the Paris Agreement currently does not force countries to include in their national totals the GHG emissions associated with international transport. These emissions are reported separately and not subject to limitation and reduction commitments of Annex 1 Parties under the Climate Convention and Kyoto Protocol.[8] The carbon footprint methodology includes GHG emissions associated with international transport. This means it assigns emissions caused by international trade to the importing country.
Underlying concepts for calculations
The calculation of the carbon footprint of a product, service or sector requires expert knowledge and careful examination of what is to be included. Carbon footprints can be calculated at different scales: for whole countries, for cities,[47] neighborhoods and also for sectors, companies and products.[48] For calculating personal carbon footprints, several free online carbon footprint calculators exist.[49][50]
Software (such as the "Scope 3 Evaluator") exists that can help companies to report emissions throughout their value chain.[51] The software tools can assist consultants and researchers in modelling global sustainability footprints. In each situation there are a number of questions that need to be answered, for example which activities are linked to which emissions, and which proportion should be attributed to which company. In general, software is essential for the management of corporations but new ways of enterprise resource planning are needed in order to improve corporate sustainability performance.[52]
To achieve 95% carbon footprint coverage, it would be necessary to follow up on 12 million individual supply-chain contributions (based on analyzing 12 sectoral case studies).[53] The Scope 3 calculations can be made easier using input-output analysis, a technique which was originally developed by Nobel-Prize winning economist Wassily Leontief.[53]
Consumption-based emission accounting based on input-output analysis


Consumption-based emission accounting (also called consumption-based carbon accounting[9]) traces back the impacts of demand for goods and services to the end consumer. It places responsibility to demand along the global supply chain all the way to the end consumer. In contrast, a production-based approach to calculating GHG emissions is not a carbon footprint analysis: The production-based approach (also called territorial-based approach) only includes impacts physically produced in the country in question.[55] Consumption-based accounting redistributes the emissions from production-based accounting and considers that emissions in another country are necessary for the home country's consumption bundle.[55]
Consumer-based accounting is based on input-output analysis and is used at the highest levels for any economic research question related to environmental or social impacts.[56] Analysis of global supply chains is possible using consumption-based accounting through input-output analysis assisted by using super-computing capacity.[5]
Input-output analysis (IO) was created by Nobel Prize-winning economist Wassily Leontief to demonstrate the relationship between consumption and production in an economy. It incorporates the entire supply chain, using input-output tables from countries' national accounts and international data such as UN Comtrade and Eurostat. Input-output analysis has been extended globally to multi-regional input-output analysis (MRIO), aided by innovations and technology enabling the analysis of billions of supply chains. Standards set by the United Nations underpin this analysis.[57]: 280 The analysis enables a Structural Path Analysis which scans and ranks the top supply chain nodes and paths, conveniently listing the hotspots for urgent action. Input-output analysis has increased in popularity because of its ability to interrogate global value chains.[58][59]
Combination with life cycle analysis (LCA)

In general, Life cycle assessment or LCA (also known as life cycle analysis) is a methodology for assessing allenvironmental impacts associated with the life cycle of a commercial product, process, or service - not just the greenhouse gas emissions. It includes for example also issues of water pollution, air pollution, ecotoxicity and so forth. Some widely recognized procedures for LCA are included in the ISO 14000 series of environmental management standards. A standard called ISO 14040:2006 has the framework for conducting an LCA study.[60] ISO 14060 family of standards provides further sophisticated tools for quantifying, monitoring, reporting and validating or verifying of GHG emissions and removals.[61]
Greenhouse gas product life cycle assessments can also comply with specifications such as Publicly Available Specification (PAS) 2050 and the GHG Protocol Life Cycle Accounting and Reporting Standard.[62][63]
An advantage of LCA is the high level of detail that can be obtained on-site or by liaising with suppliers. However, LCA has been hampered by the artificial construction of a boundary after which the impact of no further upstream suppliers are considered. This can introduce significant truncation errors. LCA has been combined with input-output analysis (IO), thereby enabling on-site detailed knowledge to be incorporated, where known, while IO connects to global economic databases to incorporate the entire supply chain.[64]
Critique
Relationship with other environmental impacts
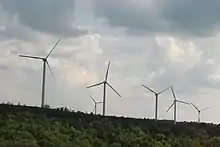
If people only focus on carbon footprints they could ignore or even exacerbate other related environmental issues of concern such as biodiversity loss, ecotoxicity, habitat destruction. These other human impacts on the environment may not be as easily measurable with a single indicator like the carbon footprint. For example, consumers may think that the carbon footprint is a proxy for environmental impact, however there are many examples where this is not correct.[65]: 222 There can in fact be trade-offs between reducing the carbon footprint and environmental protection goals. For example, whilst biofuel is a renewable energy source and can reduce the carbon footprint of energy supply, it can nevertheless pose ecological challenges during its production as it is often produced in monocultures with ample use of fertilizers and pesticides.[65]: 222 Another example are offshore wind parks that could have unintended impacts on marine ecosystems.[65]: 223
The carbon footprint analysis solely focuses on greenhouse gas emissions, unlike a life-cycle assessment which is much broader and looks at all environmental impacts. Therefore, it is useful to stress in communication activities that the carbon footprint is just one in a family of indicators (e.g. ecological footprint, water footprint, land footprints and material footprints), and should not be looked at in isolation.[66] In fact, the carbon footprint can be treated as one component of the ecological footprint.[67][13]
One example for a suitable tool to put the carbon footprint analysis into a wider perspective is the "Sustainable Consumption and Production Hotspot Analysis Tool "(SCP-HAT) which includes a number of socio-economic and environmental indicators.[68][69] It offers calculations that are either consumption-based (i.e. following the carbon footprint approach) or production-based. The database of the SCP-HAT tool is underpinned by input-output analysis. This means it includes Scope 3 emissions. The IO methodology is also governed by UN standards[57]: 280 and is based on input-output tables of countries' national accounts and also international trade data such as UN Comtrade,[70] so it is comparable worldwide.[69]
Shifting responsibility from corporations to individuals
Critics argue that the original aim of promoting the personal carbon footprint concept was to shift responsibility away from the corporations and institutions and onto personal lifestyle choices.[71][72] For example, the fossil fuel company BP had run a large advertising campaign for the personal carbon footprint in 2005 which helped popularize this concept.[71] This strategy, also employed by other major fossil fuel companies, has been criticized for trying to shift the blame for negative consequences of those industries onto individual choices.[71][73]
Geoffrey Supran and Naomi Oreskes of Harvard University have argued that concepts such as carbon footprints "hamstring us, and they put blinders on us, to the systemic nature of the climate crisis and the importance of taking collective action to address the problem".[74][75]
Differing boundaries for calculations
The term carbon footprint has been applied to limited calculations that do not include Scope 3 emissions or the entire supply chain. This can lead to claims of misleading customers with regards to the real carbon footprints of companies or products.[36]
Reported values
Greenhouse gas emissions overview

Greenhouse gas emissions (abbreviated as GHG emissions) from human activities strengthen the greenhouse effect, contributing to climate change. Carbon dioxide (CO2), from burning fossil fuels such as coal, oil, and natural gas, is one of the most important factors in causing climate change. The largest emitters are China followed by the US, although the United States has higher emissions per capita. The main producers fueling the emissions globally are large oil and gas companies. Human-caused emissions have increased atmospheric carbon dioxide by about 50% over pre-industrial levels. The growing levels of emissions have varied, but have been consistent among all greenhouse gases. Emissions in the 2010s averaged 56 billion tons a year, higher than any decade before.[77] Total cumulative emissions from 1870 to 2017 were 425±20 GtC (1539 GtCO2) from fossil fuels and industry, and 180±60 GtC (660 GtCO2) from land use change. Land-use change, such as deforestation, caused about 31% of cumulative emissions over 1870–2017, coal 32%, oil 25%, and gas 10%.[78]
Carbon dioxide (CO2) is the dominant-emitted greenhouse gas (by humans), is the next-most important greenhouse gas (accounting for more than half of the warming), while methane (CH4) emissions have almost the same short-term impact.[79] Nitrous oxide (N2O) and fluorinated gases (F-gases) play a lesser role in comparison.By products
The Carbon Trust has worked with UK manufacturers to produce "thousands of carbon footprint assessments". As of 2014 The Carbon Trust state they have measured 28,000 certifiable product carbon footprints.[80]
Food
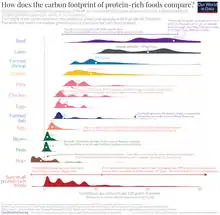
Plant-based foods tend to have a lower carbon footprint than meat and dairy. In many cases a much smaller footprint. This holds true when comparing the footprint of foods in terms of their weight, protein content or calories.[1] As an example: producing 100 grams of protein from peas emits just 0.4 kilograms of carbon dioxide equivalents (CO2eq). To get the same amount of protein from beef, emissions would be nearly 90 times higher, at 35 kgCO2eq.[1] Only a small fraction of the carbon footprint of food comes from transport and packaging. Most of it comes from processes on the farm, or from land use change. This means the choice of what to eat has a larger potential to reduce carbon footprint than how far the food has traveled, or how much packaging it is wrapped in.[1]
By sector
The IPCC Sixth Assessment Report found that global GHG emissions have continued to rise across all sectors, most rapidly in transport and industry.[81] driven by increased global consumption. A key driver of global carbon emissions is affluence, with the IPCC noting that the global wealthiest 10% contribute between about one-third to half (36%–45%) of global GHG emissions. Affluence has been noted by researchers previously as being the key driver of carbon emissions, outpacing the negative impact of population growth and the positive effect of technological developments; continued economic growth mirrors the increasing trend in material extraction and GHG emissions.[82] The IPCC highlighted: “Industrial emissions have been growing faster since 2000 than emissions in any other sector, driven by increased basic materials extraction and production”.[83]
Transport

There can be wide variation in emissions for transport of people depending primarily on a) the length of the trip, b) the source of electricity in the local grid, c) the occupancy of public transport and d) in the case of driving — the vehicle and number of passengers.[84] For example, over short to medium distances, walking or cycling are nearly always the lowest carbon way to travel. The carbon footprint of cycling one kilometer is usually in the range of 16 to 50 grams CO2eq per km. For moderate-to-long distances, trains are nearly always the option with the lowest carbon footprint compared to the other options.[84]
Carbon accounting
| Part of a series on |
| Climate change and society |
|---|
Carbon accounting (or greenhouse gas accounting) is a framework of methods to measure and track how much greenhouse gas (GHG) an organization emits.[85] It can also be used to track projects or actions to reduce emissions in sectors such as forestry or renewable energy. Corporations, cities and other groups use these techniques to help limit climate change. Organizations will often set an emissions baseline, create targets for reducing emissions, and track progress towards them. The accounting methods enable them to do this in a more consistent and transparent manner.
GHG accounting is often done to address social responsibility concerns, or meet legal requirements. Other motivations include public rankings alongside other companies, financial due diligence, and potential cost savings. GHG accounting methods can help investors better understand the climate risks of companies they invest in. Corporate and community net-zero goals are also aided by accurate accounting methods. There are now many governments around the world that require various forms of reporting, and there is some evidence that programs that require GHG accounting have the effect of lowering emissions.[86] Markets for buying and selling carbon credits also depend on accurate measurement of emissions and emission reductions. These techniques can also help understand the impacts of specific products and services by quantifying their GHG emissions throughout their lifecycle. This can promote more environmentally friendly purchasing decisions.By country

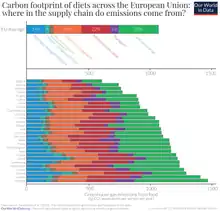
CO2 emissions of countries are typically measured on the basis of production. This accounting method – which is sometimes referred to as territorial emissions – is used for when countries report their emissions, and set targets domestically and internationally, such as the Nationally Determined Contributions.[7] Consumption-based emissions on the other hand are adjusted for trade. To calculate consumption-based emissions we need to track which goods are traded across the world, and whenever a good was imported we need to include all CO2 emissions that were emitted in the production of that good. Consumption-based emissions reflect the consumption and lifestyle choices of a country's citizens.[6]
According to the World Bank, the global average carbon footprint in 2014 was about 5 metric tons CO2 per person (production based).[87] The EU average for 2007 was about 13.8 tons CO2e per person, whereas for the U.S., Luxembourg and Australia it was over 25 tons CO2e per person. In 2017, the average for the USA was about 20 metric tons CO2e per person. This is one of the highest per capita figures in the world.[88]
The footprints per capita of countries in Africa and India were well below average. Though the per capita emission in India is lower for its huge population, the country is third largest emitter of CO2 and fifth largest economy by nominal GDP in the world.[89] To set these numbers into context, assuming a global population around 9–10 billion by 2050 a carbon footprint of about 2–2.5 tons CO2e per capita is needed to stay within a 2 °C target. These carbon footprint calculations are based on a consumption based approach using a Multi-Regional Input-Output (MRIO) database, which accounts for all greenhouse gas (GHG) emissions in the global supply chain and allocates them to the final consumer of the purchased commodities.[90]
Reducing the carbon footprint
.jpg.webp)
Climate change mitigation
Efforts that aim to reduce the carbon footprint of products, services, organizations etc. are a contribution to limit climate change (climate change mitigation).
Reducing industry's carbon footprint
Carbon offsetting can reduce a company's overall carbon footprint by offering a carbon credit.[94] This works by counteracting carbon dioxide emissions with an equivalent reduction of carbon dioxide in the atmosphere. Reforestation, the restocking of existing forests or woodlands that have previously been depleted, is an example of carbon offsetting.
A carbon footprint study using input-output analysis can identify specific and critical areas for improvement because it scrutinizes the entire supply chain.[57] Such an analysis could be used to eliminate the most impactful supply chains, i.e. those with the highest greenhouse gas emissions.
History
The term carbon footprint was first used in a BBC vegetarian food magazine in 1999, though the broader concept of environmental footprint had been used since at least 1979.[95]
In 2005, the large advertising campaign Ogilvy worked for the fossil fuel company BP to popularize the idea of a carbon footprint for individuals.[71][72] The campaign instructed people to calculate their personal footprints and provided ways for people to "go on a low-carbon diet".[96][97][98]
The carbon footprint is "rooted in the language of ecological footprinting".[13] Unlike the ecological footprint, the carbon footprint is however not expressed in area-based units. The first academic publication about ecological footprints was written by William Rees in 1992.[99] Other related concepts from the 1990s are the "ecological backpack" and Material input per unit of service (MIPS).[100]
Trends
To bring global, rigorous oversight to carbon footprint reporting, an International Sustainability Standards Board (ISSB) has formed out of the International Financial Reporting Standards, which will require companies to report on their Scope 3 emissions.[101] The ISSB has taken on board criticisms of other initiatives in its aims for universality,[102] consolidating the Carbon Disclosure Standards Board, the Sustainability Accounting Standards Board and the Value Reporting Foundation. It is complementing the Global Reporting Initiative and is influenced by the Task Force on Climate-Related Financial Disclosures. As of early 2023, Great Britain and Nigeria are already preparing to adopt them.[103]

References
- "You want to reduce the carbon footprint of your food? Focus on what you eat, not whether your food is local". Our World in Data. Retrieved 7 July 2023.
 Text was copied from this source, which is available under a Creative Commons Attribution 4.0 International License
 - "What is a carbon footprint". www.conservation.org. Retrieved 28 May 2023.
- IPCC, 2022: Annex I: Glossary Archived 13 March 2023 at the Wayback Machine [van Diemen, R., J.B.R. Matthews, V. Möller, J.S. Fuglestvedt, V. Masson-Delmotte, C. Méndez, A. Reisinger, S. Semenov (eds)]. In IPCC, 2022: Climate Change 2022: Mitigation of Climate Change. Contribution of Working Group III to the Sixth Assessment Report of the Intergovernmental Panel on Climate Change Archived 2 August 2022 at the Wayback Machine [P.R. Shukla, J. Skea, R. Slade, A. Al Khourdajie, R. van Diemen, D. McCollum, M. Pathak, S. Some, P. Vyas, R. Fradera, M. Belkacemi, A. Hasija, G. Lisboa, S. Luz, J. Malley, (eds.)]. Cambridge University Press, Cambridge, UK and New York, NY, USA. doi:10.1017/9781009157926.020
- Green Element Ltd., What is the Difference Between Scope 1, 2 and 3 Emissions? Archived 11 November 2020 at the Wayback Machine, published 2 November 2018, accessed 11 November 2020
- "Input Output Analysis - an overview | ScienceDirect Topics". www.sciencedirect.com. Retrieved 11 June 2023.
- "How do CO2 emissions compare when we adjust for trade?". Our World in Data. Retrieved 7 July 2023. Text was copied from this source, which is available under a Creative Commons Attribution 4.0 International License
- Eggleston, S., Buendia, L., Miwa, K., Ngara, T., & Tanabe, K. (Eds.). (2006). 2006 IPCC guidelines for national greenhouse gas inventories (Vol. 5). Hayama, Japan: Institute for Global Environmental Strategies.
- "Emissions from fuels used for international aviation and maritime transport". unfccc.int. Retrieved 11 June 2023.
- Tukker, Arnold; Pollitt, Hector; Henkemans, Maurits (22 April 2020). "Consumption-based carbon accounting: sense and sensibility". Climate Policy. 20 (sup1): S1–S13. doi:10.1080/14693062.2020.1728208. hdl:1887/3135062. ISSN 1469-3062. S2CID 214525354.
- Wright, L.; Kemp, S.; Williams, I. (2011). "'Carbon footprinting': towards a universally accepted definition". Carbon Management. 2 (1): 61–72. doi:10.4155/CMT.10.39. S2CID 154004878.
- Wright, Laurence A; Kemp, Simon; Williams, Ian (2011). "'Carbon footprinting': towards a universally accepted definition". Carbon Management. 2 (1): 61–72. doi:10.4155/cmt.10.39. ISSN 1758-3004. S2CID 154004878.
- "Corporate Standard Greenhouse Gas Protocol". Archived from the original on 29 July 2022. Retrieved 29 July 2022.
- Wiedmann, T. and Minx, J. (2008). A Definition of 'Carbon Footprint' Archived 22 March 2023 at the Wayback Machine. In: C. C. Pertsova, Ecological Economics Research Trends: Chapter 1, pp. 1-11, Nova Science Publishers, Hauppauge NY, USA.
- Ritchie, Hannah; Roser, Max; Rosado, Pablo (11 May 2020). "CO₂ and Greenhouse Gas Emissions". Our World in Data.
- "Greenhouse Gas Protocol". World Resources Institute. 2 May 2023. Retrieved 19 July 2023.
- "Corporate Value Chain (Scope 3) Accounting and Reporting Standard". Greenhouse Gas Protocol. Archived from the original on 31 January 2021. Retrieved 28 February 2016.
- "Greenhouse Gas Protocol". Archived from the original on 22 December 2020. Retrieved 25 February 2019.
- "Streamlined Energy And Carbon Reporting Guidance UK". LongevityIntelligen. Retrieved 16 July 2020.
- "Product Life Cycle Accounting and Reporting Standard" (PDF). GHG Protocol. Archived (PDF) from the original on 25 February 2019. Retrieved 25 February 2019.
- Bellassen, Valentin (2015). Accounting for Carbon Monitoring, Reporting and Verifying Emissions in the Climate Economy. Cambridge University Press. p. 6. ISBN 9781316162262.
- "Scope 2 Calculation Guidance" (PDF). GHG Protocol. Archived (PDF) from the original on 21 October 2020. Retrieved 25 February 2019.
- EPA, OA, US (23 December 2015). "Overview of Greenhouse Gases | US EPA". US EPA. Archived from the original on 12 August 2016. Retrieved 1 November 2017.
- "Corporate Value Chain (Scope 3) Standard | Greenhouse Gas Protocol". ghgprotocol.org. Archived from the original on 9 December 2021. Retrieved 9 December 2021.
- Bokern, D. (9 March 2022). "Reported Emission Footprints: The Challenge is Real". MSCI. Retrieved 22 January 2023.
- Molé, P. (1 November 2022). "ISSB Votes to Include Scope 3 Greenhouse Gas (GHG) Emission Disclosures in Updates to Draft Standards". VelocityEHS. Retrieved 22 January 2023.
- "Are consumption-based CO₂ per capita emissions above or below the global average?". Our World in Data. Retrieved 7 July 2023.
- Lynas, Mark; Houlton, Benjamin Z.; Perry, Simon (19 October 2021). "Greater than 99% consensus on human caused climate change in the peer-reviewed scientific literature". Environmental Research Letters. 16 (11): 114005. Bibcode:2021ERL....16k4005L. doi:10.1088/1748-9326/ac2966. S2CID 239032360.
- Allen, M.R., O.P. Dube, W. Solecki, F. Aragón-Durand, W. Cramer, S. Humphreys, M. Kainuma, J. Kala, N. Mahowald, Y. Mulugetta, R. Perez, M.Wairiu, and K. Zickfeld, 2018: Chapter 1: Framing and Context. In: Global Warming of 1.5°C. An IPCC Special Report on the impacts of global warming of 1.5°C above pre-industrial levels and related global greenhouse gas emission pathways, in the context of strengthening the global response to the threat of climate change, sustainable development, and efforts to eradicate poverty [Masson-Delmotte, V., P. Zhai, H.-O. Pörtner, D. Roberts, J. Skea, P.R. Shukla, A. Pirani, W. Moufouma-Okia, C. Péan, R. Pidcock, S. Connors, J.B.R. Matthews, Y. Chen, X. Zhou, M.I. Gomis, E. Lonnoy, T. Maycock, M. Tignor, and T. Waterfield (eds.)]. Cambridge University Press, Cambridge, UK and New York, NY, USA, pp. 49-92. doi:10.1017/9781009157940.003.
- Ritchie, Hannah (18 September 2020). "Sector by sector: where do global greenhouse gas emissions come from?". Our World in Data. Retrieved 28 October 2020.
- European Commission. Joint Research Centre. (2022). CO2 emissions of all world countries :JRC/IEA/PBL 2022 report. LU: Publications Office. doi:10.2760/730164. ISBN 9789276558026.
- UNFCCC. "The Paris Agreement". unfccc.int. Archived from the original on 19 March 2021. Retrieved 18 September 2021.
- Schleussner, Carl-Friedrich. "The Paris Agreement – the 1.5 °C Temperature Goal". Climate Analytics. Retrieved 29 January 2022.
- "What is the difference between Scope 1, 2 and 3 emissions, and what are companies doing to cut all three?". World Economic Forum. 20 September 2022. Retrieved 28 May 2023.
- Lenzen, Manfred; Murray, Joy (2009). "Input into Greenhouse Gas Protocol Technical Working Group discussion on sectoral value chain mapping of emissions by purchased categories" (PDF). Retrieved 28 May 2023.
- Lenzen, M; Treloar, G (1 February 2002). "Embodied energy in buildings: wood versus concrete—reply to Börjesson and Gustavsson". Energy Policy. 30 (3): 249–255. doi:10.1016/S0301-4215(01)00142-2. ISSN 0301-4215.
- Vivienne Reiner, Arunima Malik, Manfred Lenzen (24 February 2022). "Google and Amazon misled about their carbon footprint. But what about the rest of us?". The Canberra Times. Retrieved 28 May 2023.
{{cite web}}: CS1 maint: multiple names: authors list (link) - Wiedmann, Thomas; Lenzen, Manfred (2018). "Environmental and social footprints of international trade". Nature Geoscience. 11 (5): 314–321. doi:10.1038/s41561-018-0113-9. ISSN 1752-0894. S2CID 134496973.
- Reiner, Vivienne; Malik, Arunima (13 October 2021). "Carbon 'footprinting' could accurately measure countries' emissions". news.com.au. Retrieved 7 July 2023.
- "UK in 'delusion' over emissions". 31 July 2008. Retrieved 19 June 2023.
- Wiedmann, T., Wood, R., Lenzen, M., Minx, J., Guan, D. and Barrett, J. (2007) Development of an Embedded Carbon Emissions Indicator – Producing a Time Series of Input-Output Tables and Embedded Carbon Dioxide Emissions for the UK by Using a MRIO Data Optimisation System, Report to the UK Department for Environment, Food and Rural Affairs by Stockholm Environment Institute at the University of York and Centre for Integrated Sustainability Analysis at the University of Sydney, June 2008. Defra, London, UK
- Kanemoto, K.; Moran, D.; Lenzen, M.; Geschke, A. (2014). "International trade undermines national emission reduction targets: New evidence from air pollution". Global Environmental Change. 24: 52–59. doi:10.1016/j.gloenvcha.2013.09.008. ISSN 0959-3780.
- Lenzen, Manfred; Moran, Daniel; Bhaduri, Anik; Kanemoto, Keiichiro; Bekchanov, Maksud; Geschke, Arne; Foran, Barney (1 October 2013). "International trade of scarce water". Ecological Economics. 94: 78–85. doi:10.1016/j.ecolecon.2013.06.018. ISSN 0921-8009.
- Lenzen, M.; Moran, D.; Kanemoto, K.; Foran, B.; Lobefaro, L.; Geschke, A. (June 2012). "International trade drives biodiversity threats in developing nations". Nature. 486 (7401): 109–112. doi:10.1038/nature11145. ISSN 1476-4687. PMID 22678290. S2CID 1119021.
- Wiedmann, Thomas O.; Schandl, Heinz; Lenzen, Manfred; Moran, Daniel; Suh, Sangwon; West, James; Kanemoto, Keiichiro (19 May 2015). "The material footprint of nations". Proceedings of the National Academy of Sciences. 112 (20): 6271–6276. doi:10.1073/pnas.1220362110. ISSN 0027-8424. PMC 4443380. PMID 24003158.
- Lan, Jun; Malik, Arunima; Lenzen, Manfred; McBain, Darian; Kanemoto, Keiichiro (1 February 2016). "A structural decomposition analysis of global energy footprints". Applied Energy. 163: 436–451. doi:10.1016/j.apenergy.2015.10.178. ISSN 0306-2619.
- Lenzen, Manfred; Murray, Joy; Sack, Fabian; Wiedmann, Thomas (2007). "Shared producer and consumer responsibility — Theory and practice". Ecological Economics. 61 (1): 27–42. doi:10.1016/j.ecolecon.2006.05.018.
- Wiedmann, Thomas; Chen, Guangwu; Owen, Anne; Lenzen, Manfred; Doust, Michael; Barrett, John; Steele, Kristian (2021). "Three‐scope carbon emission inventories of global cities". Journal of Industrial Ecology. 25 (3): 735–750. doi:10.1111/jiec.13063. ISSN 1088-1980. S2CID 224842866.
- Department for Business, Energy & Industrial Strategy (25 June 2020). "UK local authority carbon dioxide emissions estimates 2018" (PDF). GOV.UK. Archived (PDF) from the original on 26 January 2021. Retrieved 13 April 2021.
- "My Carbon Plan - Carbon Footprint Calculator, which provides a calculator using ONS data in the UK". mycarbonplan.org. Archived from the original on 27 July 2020. Retrieved 4 April 2020.
- "CO2List.org which shows CO2 coming from common products and activities". co2list.org. Archived from the original on 3 October 2019. Retrieved 4 October 2019.
- "Scope 3 Evaluator | GHG Protocol". ghgprotocol.org. Retrieved 11 June 2023.
- Hack, Stefan; Berg, Christian (2 July 2014). "The Potential of IT for Corporate Sustainability". Sustainability. 6 (7): 4163–4180. doi:10.3390/su6074163. ISSN 2071-1050.
- "Pain-free scope 3. Input into Greenhouse Gas Protocol Technical Working Group discussion on sectoral value chain mapping of emissions by purchased categories" (PDF). Retrieved 11 June 2023.
- "Consumption-based vs. production-based CO₂ emissions per capita". Our World in Data. Retrieved 7 July 2023.
- Dietzenbacher, Erik; Cazcarro, Ignacio; Arto, Iñaki (2020). "Towards a more effective climate policy on international trade". Nature Communications. 11 (1): 1130. doi:10.1038/s41467-020-14837-5. ISSN 2041-1723. PMC 7048780. PMID 32111849. Text was copied from this source, which is available under a Creative Commons Attribution 4.0 International License
- Malik, Arunima; McBain, Darian; Wiedmann, Thomas O.; Lenzen, Manfred; Murray, Joy (2019). "Advancements in Input‐Output Models and Indicators for Consumption‐Based Accounting". Journal of Industrial Ecology. 23 (2): 300–312. doi:10.1111/jiec.12771. ISSN 1088-1980. S2CID 158533390.
- Division, UN Statistics (1999). Handbook of input-output table compilation and analysis.
- "World Trade Organization - Global Value Chains". www.wto.org. Retrieved 5 June 2023.
- Dietzenbacher, Erik; Lahr, Michael L.; Lenzen, Manfred, eds. (31 July 2020). "Recent Developments in Input–Output Analysis". Elgar Research Reviews in Economics. doi:10.4337/9781786430816. ISBN 9781786430809. S2CID 225409688.
- "Environmental management -- Life cycle assessment -- Principles and framework". International Organization for Standardization. 12 August 2014. Archived from the original on 26 February 2019. Retrieved 25 February 2019.
- DIN EN ISO 14067:2019-02, Treibhausgase_- Carbon Footprint von Produkten_- Anforderungen an und Leitlinien für Quantifizierung (ISO_14067:2018); Deutsche und Englische Fassung EN_ISO_14067:2018, Beuth Verlag GmbH, doi:10.31030/2851769
- "PAS 2050:2011 Specification for the assessment of the life cycle greenhouse gas emissions of goods and services". BSI. Retrieved on: 25 April 2013.
- "Product Life Cycle Accounting and Reporting Standard" Archived 9 May 2013 at the Wayback Machine. GHG Protocol. Retrieved on: 25 April 2013.
- Lenzen, Manfred (2000). "Errors in Conventional and Input-Output—based Life—Cycle Inventories". Journal of Industrial Ecology. 4 (4): 127–148. doi:10.1162/10881980052541981. ISSN 1088-1980. S2CID 154022052.
- Berg, Christian (2020). Sustainable action: overcoming the barriers. Abingdon, Oxon. ISBN 978-0-429-57873-1. OCLC 1124780147.
{{cite book}}: CS1 maint: location missing publisher (link) - Fang, K.; Heijungs, R.; De Snoo, G.R. (2014). "Theoretical exploration for the combination of the ecological, energy, carbon, and water footprints: Overview of a footprint family". Ecological Indicators. 36: 508–518. doi:10.1016/j.ecolind.2013.08.017.
- Wiedmann, Thomas; Barrett, John (2010). "A Review of the Ecological Footprint Indicator—Perceptions and Methods". Sustainability. 2 (6): 1645–1693. doi:10.3390/su2061645. ISSN 2071-1050.
- "SCP Hotspots Analysis". Retrieved 5 June 2023.
- Piñero, P., Sevenster, M., Lutter, S., Giljum, S. (2021). Technical documentation of the Sustainable Consumption and Production Hotspots Analysis Tool (SCPHAT) version 2.0. Commissioned by UN Life Cycle Initiative, One Planet Network, and UN International Resource Panel. Paris.
- "UN Comtrade". comtradeplus.un.org. Retrieved 19 June 2023.
- Kaufman, Mark (13 July 2020). "The devious fossil fuel propaganda we all use". Mashable. Archived from the original on 17 September 2020. Retrieved 17 September 2020.
- Turner, James Morton (2014). "Counting Carbon: The Politics of Carbon Footprints and Climate Governance from the Individual to the Global". Global Environmental Politics. 14 (1): 59–78. doi:10.1162/GLEP_a_00214. ISSN 1526-3800. S2CID 15886043.
- Westervelt, Amy (14 May 2021). "Big Oil Is Trying to Make Climate Change Your Problem to Solve. Don't Let Them". Rolling Stone. Archived from the original on 21 June 2021. Retrieved 13 June 2021.
- Leber, Rebecca (13 May 2021). "ExxonMobil wants you to feel responsible for climate change so it doesn't have to". Vox. Archived from the original on 25 March 2023. Retrieved 25 March 2023.
- Supran, Geoffrey; Oreskes, Naomi (May 2021). "Rhetoric and frame analysis of ExxonMobil's climate change communications". One Earth. 4 (5): 696–719. Bibcode:2021OEart...4..696S. doi:10.1016/j.oneear.2021.04.014. ISSN 2590-3322. S2CID 236343941.
- ● "Territorial (MtCO2)". GlobalCarbonAtlas.org. Retrieved 30 December 2021. (choose "Chart view"; use download link)
● Data for 2020 is also presented in Popovich, Nadja; Plumer, Brad (12 November 2021). "Who Has The Most Historical Responsibility for Climate Change?". The New York Times. Archived from the original on 29 December 2021.
● Source for country populations: "List of the populations of the world's countries, dependencies, and territories". britannica.com. Encyclopedia Britannica. - "Chapter 2: Emissions trends and drivers" (PDF). Ipcc_Ar6_Wgiii. 2022. Archived from the original (PDF) on 12 April 2022. Retrieved 4 April 2022.
- "Global Carbon Project (GCP)". www.globalcarbonproject.org. Archived from the original on 4 April 2019. Retrieved 19 May 2019.
- "Methane vs. Carbon Dioxide: A Greenhouse Gas Showdown". One Green Planet. 30 September 2014. Retrieved 13 February 2020.
- "Footprint measurement". The Carbon Trust. Archived from the original on 23 December 2014. Retrieved 14 August 2012.
- "IPCC 6th Assessment Report. WG III. Mitigation of Climate Change. Chapter 2 Emissions Trends and Drivers pp. 215-294" (PDF). 2022. p. 218. Retrieved 11 June 2023.
- Wiedmann, Thomas; Lenzen, Manfred; Keyßer, Lorenz T.; Steinberger, Julia K. (19 June 2020). "Scientists' warning on affluence". Nature Communications. 11 (1): 3107. doi:10.1038/s41467-020-16941-y. ISSN 2041-1723. PMC 7305220. PMID 32561753.
- "IPCC 6th Assessment Report. WG III. Full Report. 2029p" (PDF). p. 1163. Retrieved 11 June 2023.
- "Which form of transport has the smallest carbon footprint?". Our World in Data. Retrieved 7 July 2023.}} Text was copied from this source, which is available under a Creative Commons Attribution 4.0 International License
- "Carbon Accounting". Corporate Finance Institute. Retrieved 6 January 2023.
- Downar, Benedikt; Ernstberger, Jürgen; Reichelstein, Stefan; Schwenen, Sebastian; Zaklan, Aleksandar (1 September 2021). "The impact of carbon disclosure mandates on emissions and financial operating performance". Review of Accounting Studies. 26 (3): 1137–1175. doi:10.1007/s11142-021-09611-x. ISSN 1573-7136. S2CID 220061770.
- "CO2 emissions (metric tons per capita)". The World Bank. Archived from the original on 6 March 2019. Retrieved 4 March 2019.
- "What is your carbon footprint?". The Nature Conservancy. Archived from the original on 10 September 2021. Retrieved 25 September 2021.
- Nandy, S.N. (2023). Differential Carbon Footprint in India – An Economic Perspective. Journal of Sustainability and Environmental Management, 2(1), 74–82. https://doi.org/10.3126/josem.v2i1.53119
- Tukker, Arnold; Bulavskaya, Tanya; Giljum, Stefan; de Koning, Arjan; Lutter, Stephan; Simas, Moana; Stadler, Konstantin; Wood, Richard (2016). "Environmental and resource footprints in a global context: Europe's structural deficit in resource endowments". Global Environmental Change. 40: 171–181. doi:10.1016/j.gloenvcha.2016.07.002.
- IPCC, 2021: Annex VII: Glossary [Matthews, J.B.R., V. Möller, R. van Diemen, J.S. Fuglestvedt, V. Masson-Delmotte, C. Méndez, S. Semenov, A. Reisinger (eds.)]. In Climate Change 2021: The Physical Science Basis. Contribution of Working Group I to the Sixth Assessment Report of the Intergovernmental Panel on Climate Change [Masson-Delmotte, V., P. Zhai, A. Pirani, S.L. Connors, C. Péan, S. Berger, N. Caud, Y. Chen, L. Goldfarb, M.I. Gomis, M. Huang, K. Leitzell, E. Lonnoy, J.B.R. Matthews, T.K. Maycock, T. Waterfield, O. Yelekçi, R. Yu, and B. Zhou (eds.)]. Cambridge University Press, Cambridge, United Kingdom and New York, NY, USA, pp. 2215–2256, doi:10.1017/9781009157896.022.
- Olivier J.G.J. and Peters J.A.H.W. (2020), Trends in global CO2 and total greenhouse gas emissions: 2020 report. PBL Netherlands Environmental Assessment Agency, The Hague.
- "Sector by sector: where do global greenhouse gas emissions come from?". Our World in Data. Retrieved 16 November 2022.
- Corbett, James (2008). "Carbon Footprint". In Brenda Wilmoth Lerner; K. Lee Lerner (eds.). Climate Change: In Context, vol. 1. Gale. pp. 162–164. ISBN 978-1-4144-3708-8.
- "carbon, n." OED Online. Oxford University Press. Archived from the original on 24 March 2023. Retrieved 24 March 2023.
- "BP Global - Environment and society - Carbon reduction". 12 February 2006. Archived from the original on 12 February 2006. Retrieved 13 June 2021.
- Supran, Geoffrey; Oreskes, Naomi (18 November 2021). "The forgotten oil ads that told us climate change was nothing". The Guardian. Archived from the original on 18 November 2021. Retrieved 24 March 2023.
- "Climatarian: the "zero emissions" meal". BCFN Foundation. 24 June 2016. Retrieved 6 February 2020.
- Rees, William E. (October 1992). "Ecological footprints and appropriated carrying capacity: what urban economics leaves out". Environment & Urbanization. 4 (2): 121–130. doi:10.1177/095624789200400212.
- Ritthoff, M; Rohn, H; Liedtke, C (2003). Calculating MIPS – Resource productivity of products and services. Wuppertal Institute. Accessed 22 February 2012
- "IFRS - ISSB unanimously confirms Scope 3 GHG emissions disclosure requirements with strong application support, among key decisions". www.ifrs.org. Retrieved 11 June 2023.
- "Making sense of ISSB | Deloitte Australia | About Deloitte". Deloitte Australia. Retrieved 11 June 2023.
- Jones, Huw (16 February 2023). "G20-backed standards body approves first global company sustainability rules". Reuters. Retrieved 11 June 2023.
External links
| |||||||||||||
| |||||||||||||
| |||||||||||||
| |||||||||||||
| |||||||||||||
| |||||||||||||
| |||||||||||||
| |||||||||||||