Upper Falls (District Electoral Area)
Upper Falls was one of the nine district electoral areas (DEA) which existed in Belfast, Northern Ireland from 1985 to 2014. Located in the west of the city, the district elected five members to Belfast City Council and contained the wards of Andersonstown; Falls Park; Glen Road; Glencolin; and Ladybrook. Upper Falls formed part of the Belfast West constituencies for the Northern Ireland Assembly and UK Parliament. The district, along with the neighbouring Lower Falls district, took its name from the Falls Road, one of the main arterial routes in the west of the city.
| Upper Falls District Electoral Area | |
|---|---|
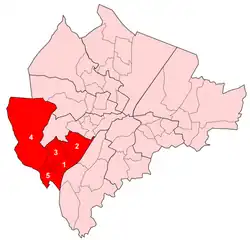 Map showing Upper Falls wards within Belfast | |
| Population | (2008 Estimate) |
| District | |
| County | |
| Country | Northern Ireland |
| Sovereign state | United Kingdom |
| UK Parliament | |
| NI Assembly | |
History
The district was created for the 1985 local elections. All five wards were part of Area D before 1985. Area D had also contained three wards which became part of the Lower Falls electoral area. Boundary changes for the 2014 local elections created an extra ward in the area and abolished the Upper Falls DEA. Four of the six wards became part of a new Black Mountain District Electoral Area, while the remaining two formed part of a new Collin District Electoral Area, together with parts of the former Lisburn City Council.
Wards
| Map | Ward | Population (2011 Census) | Catholic | Protestant | Other | No Religion | Area | Density | NI Assembly | UK Parliament | Ref |
|---|---|---|---|---|---|---|---|---|---|---|---|
| 1 | Andersonstown | 4,907 | 94.5% | 3.6% | 0.3% | 1.6% | 1.08 km2 | 4,544/km2 | Belfast West | Belfast West | [1] |
| 2 | Falls Park | 5,343 | 94.4% | 3.3% | 0.7% | 1.6% | 2.35 km2 | 2,274/km2 | Belfast West | Belfast West | [2] |
| 3 | Glen Road | 5,573 | 95.1% | 3.3% | 0.5% | 1.1% | 1.57 km2 | 3,550/km2 | Belfast West | Belfast West | [3] |
| 4 | Glencolin | 6,498 | 93.2% | 5.1% | 0.2% | 1.5% | 9.54 km2 | 681/km2 | Belfast West | Belfast West | [4] |
| 5 | Ladybrook | 6,519 | 85.3% | 10.9% | 0.6% | 3.1% | 1.29 km2 | 5,053/km2 | Belfast West | Belfast West | [5] |
| Upper Falls | 28,840 | 92.2% | 5.5% | 0.5% | 1.8% | 15.83 km2 | 1,822/km2 | Belfast West | Belfast West | ||
Councillors
| Election | Councillor (Party) |
Councillor (Party) |
Councillor (Party) |
Councillor (Party) |
Councillor (Party) | |||||
|---|---|---|---|---|---|---|---|---|---|---|
| 2011 | Emma Groves (Sinn Féin) |
Gerard O'Neill (Sinn Féin) |
Matt Garrett (Sinn Féin) |
Caoimhin Mac Giolla Mhín (Sinn Féin) |
Tim Attwood (SDLP) | |||||
| 2005 | Paul Maskey (Sinn Féin) |
Michael Browne (Sinn Féin) |
Christine Mhic Giolla Mhín (Sinn Féin) | |||||||
| 2001 | Chrissie McAuley (Sinn Féin) |
Alex Attwood (SDLP) | ||||||||
| 1997 | Alex Maskey (Sinn Féin) |
Martin Livingstone (Sinn Féin) | ||||||||
| 1993 | Una Gillespie (Sinn Féin) |
Máirtín Ó Muilleoir (Sinn Féin) |
Patricia Lewsley (SDLP) | |||||||
| 1989 | Teresa Holland (Sinn Féin) |
Cormac Boomer (SDLP) | ||||||||
| 1985 | Pip Glendinning (Alliance) | |||||||||
2011 Election
2005: 4 x Sinn Féin, 1 x SDLP
2011: 4 x Sinn Féin, 1 x SDLP
2005-2011 Change: No change
| Party | Candidate | FPv% | Count | |||
|---|---|---|---|---|---|---|
| 1 | 2 | 3 | ||||
| Sinn Féin | Matt Garrett | 18.00% | 2,250 | |||
| Sinn Féin | Gerard O'Neill* | 17.47% | 2,184 | |||
| Sinn Féin | Emma Groves | 17.07% | 2,133 | |||
| SDLP | Tim Attwood* | 16.12% | 2,015 | 2,356 | ||
| Sinn Féin | Caoimhín Mac Giolla Mhín | 15.28% | 1,910 | 1,952 | 2,009 | |
| éirígí | Pádraic Mac Coitir | 11.32% | 1,415 | 1,428 | 1,474 | |
| SDLP | Helen Walsh | 2.00% | 250 | |||
| DUP | Eileen Kingston | 1.43% | 179 | |||
| Alliance | Dan McGuinness | 1.30% | 162 | |||
| Electorate: 20,530 Valid: 12,498 (60.88%) Spoilt: 298 Quota: 2,084 Turnout: 12,796 (62.33%) | ||||||
2005 Election
2001: 4 x Sinn Féin, 1 x SDLP
2005: 4 x Sinn Féin, 1 x SDLP
2001-2005 Change: No change
| Party | Candidate | FPv% | Count | ||||
|---|---|---|---|---|---|---|---|
| 1 | 2 | 3 | 4 | ||||
| Sinn Féin | Paul Maskey* | 23.69% | 3,084 | ||||
| SDLP | Tim Attwood | 21.63% | 2,815 | ||||
| Sinn Féin | Gerard O'Neill* | 18.81% | 2,448 | ||||
| Sinn Féin | Michael Browne* | 17.34% | 2,257 | ||||
| Sinn Féin | Christine Mac Giolla Mhín | 10.97% | 1,428 | 2,070.32 | 2,089.57 | 2,325.41 | |
| SDLP | Roisin Mulholland | 3.17% | 413 | 467.56 | 1,025.56 | 1,031.83 | |
| Sinn Féin | Caoimhín Mac Giolla Mhín | 4.39% | 571 | 779.54 | 843.44 | 863.79 | |
| Electorate: 19,767 Valid: 13,016 (65.85%) Spoilt: 437 Quota: 2,170 Turnout: 13,453 (68.06%) | |||||||
2001 Election
1997: 4 x Sinn Féin, 1 x SDLP
2001: 4 x Sinn Féin, 1 x SDLP
1997-2001 Change: No change
| Party | Candidate | FPv% | Count | ||||
|---|---|---|---|---|---|---|---|
| 1 | 2 | 3 | 4 | ||||
| Sinn Féin | Paul Maskey | 21.81% | 3,349 | ||||
| SDLP | Alex Attwood* | 21.23% | 3,260 | ||||
| Sinn Féin | Gerard O'Neill | 18.66% | 2,866 | ||||
| Sinn Féin | Michael Browne* | 16.08% | 2,469 | 2,548.68 | 2,628.26 | ||
| Sinn Féin | Chrissie McAuley* | 11.73% | 1,801 | 2,442.52 | 2,494.96 | 2,592.96 | |
| SDLP | Brian Heading | 7.24% | 1,112 | 1,131.44 | 1,569.13 | 1,774.13 | |
| NI Women's Coalition | Mary Catney | 2.38% | 365 | 385.4 | 450.72 | ||
| Alliance | Mary Ayers | 0.89% | 136 | 137.92 | 183.69 | ||
| Electorate: 22,107 Valid: 15,358 (69.47%) Spoilt: 614 Quota: 2,560 Turnout: 15,972 (72.25%) | |||||||
1997 Election
1993: 3 x Sinn Féin, 2 x SDLP
1997: 4 x Sinn Féin, 1 x SDLP
1993-1997 Change: Sinn Féin gain from SDLP
| Party | Candidate | FPv% | Count | ||||
|---|---|---|---|---|---|---|---|
| 1 | 2 | 3 | 4 | ||||
| SDLP | Alex Attwood* | 20.42% | 2,855 | ||||
| Sinn Féin | Alex Maskey* | 20.08% | 2,807 | ||||
| Sinn Féin | Michael Browne | 18.45% | 2,580 | ||||
| Sinn Féin | Martin Livingstone | 17.12% | 2,394 | ||||
| Sinn Féin | Chrissie McAuley | 12.43% | 1,738 | 1,754.02 | 2,181.23 | 2,401.37 | |
| SDLP | Patricia Lewsley* | 4.26% | 596 | 982.82 | 998.63 | 1,003.22 | |
| SDLP | Stephen McGowan | 4.41% | 616 | 707.98 | 719.54 | 721.7 | |
| DUP | David McNerlin | 1.44% | 201 | 201 | 201.17 | 201.26 | |
| Workers' Party | James McAllister | 0.79% | 110 | 113.96 | 117.7 | 119.23 | |
| Alliance | Dan McGuinness | 0.61% | 85 | 91.3 | 93.34 | 93.61 | |
| Electorate: 22,561 Valid: 13,982 (61.97%) Spoilt: 345 Quota: 2,331 Turnout: 14,327 (63.50%) | |||||||
1993 Election
1989: 3 x Sinn Féin, 2 x SDLP
1993: 3 x Sinn Féin, 2 x SDLP
1989-1993 Change: No change
| Party | Candidate | FPv% | Count | |||||||||
|---|---|---|---|---|---|---|---|---|---|---|---|---|
| 1 | 2 | 3 | 4 | 5 | 6 | 7 | 8 | 9 | ||||
| SDLP | Alex Attwood* | 24.08% | 3,203 | |||||||||
| Sinn Féin | Una Gillespie | 20.79% | 2,765 | |||||||||
| Sinn Féin | Alex Maskey* | 20.56% | 2,735 | |||||||||
| Sinn Féin | Mairtin O'Muilleoir* | 15.74% | 2,093 | 2,114.12 | 2,629.32 | |||||||
| SDLP | Patricia Lewsley | 6.00% | 798 | 1,428.72 | 1,437.72 | 1,602.89 | 1,623.89 | 1,625.89 | 1,670.62 | 1,774.2 | 2,122.7 | |
| SDLP | Terence Tracey | 5.28% | 702 | 888.24 | 891.64 | 1,007.84 | 1,019.24 | 1,027.24 | 1,059.73 | 1,167.52 | 1,327.21 | |
| Independent Nationalist | Cormac Boomer* | 2.84% | 378 | 474.96 | 477.56 | 582.14 | 594.34 | 595.34 | 626.15 | 744.45 | ||
| Independent Labour | Billy Lynn | 1.08% | 144 | 154.24 | 158.24 | 242.9 | 260.7 | 271.85 | 298.53 | |||
| Alliance | Julie Greaves | 1.09% | 145 | 173.8 | 175.4 | 186.19 | 187.39 | 253.59 | 266.7 | |||
| Workers' Party | James Maxwell | 1.23% | 164 | 171.36 | 173.56 | 206.76 | 208.36 | 217.36 | ||||
| DUP | David McNerlin | 1.31% | 174 | 174.64 | 174.64 | 176.3 | 176.7 | |||||
| Electorate: 21,948 Valid: 13,301 (60.60%) Spoilt: 424 Quota: 2,217 Turnout: 13,725 (62.53%) | ||||||||||||
1989 Election
1985: 2 x Sinn Féin, 2 x SDLP, 1 x Alliance
1989: 3 x Sinn Féin, 2 x SDLP
1985-1989 Change: Sinn Féin gain from Alliance
| Party | Candidate | FPv% | Count | |||||||
|---|---|---|---|---|---|---|---|---|---|---|
| 1 | 2 | 3 | 4 | 5 | 6 | 7 | ||||
| SDLP | Alex Attwood* | 26.53% | 3,292 | |||||||
| Sinn Féin | Alex Maskey* | 19.26% | 2,378 | |||||||
| Sinn Féin | Teresa Holland* | 18.77% | 2,329 | |||||||
| SDLP | Cormac Boomer* | 9.58% | 1,189 | 2,202.46 | ||||||
| Sinn Féin | Mairtin O'Muilleoir | 15.74% | 1,435 | 1,462.74 | 1,739.64 | 1,976.47 | 2,000.75 | 2,004.3 | 2,004.67 | |
| SDLP | Peter Prendiville | 5.75% | 713 | 815.98 | 819.1 | 820.97 | 834.35 | 935.6 | 962.75 | |
| Alliance | Dan McGuinness | 2.63% | 326 | 363.24 | 365.71 | 368.35 | 374.73 | 384.88 | 505.88 | |
| Workers' Party | Jean Craig | 3.06% | 380 | 409.64 | 411.72 | 413.48 | 432.48 | 443.83 | 488.83 | |
| DUP | Robert Morrow | 2.28% | 283 | 283 | 283.39 | 283.72 | 283.72 | 283.97 | ||
| Communist | Kevin O'Donnell | 0.68% | 84 | 87.04 | 89.77 | 90.54 | ||||
| Electorate: 22,975 Valid: 12,409 (54.01%) Spoilt: 426 Quota: 2,069 Turnout: 12,835 (55.87%) | ||||||||||
1985 Election
1985: 2 x Sinn Féin, 2 x SDLP, 1 x Alliance
| Party | Candidate | FPv% | Count | |||||||||
|---|---|---|---|---|---|---|---|---|---|---|---|---|
| 1 | 2 | 3 | 4 | 5 | 6 | 7 | 8 | 9 | ||||
| SDLP | Alex Attwood | 19.35% | 2,461 | |||||||||
| Sinn Féin | Alex Maskey | 18.30% | 2,329 | |||||||||
| Sinn Féin | Teresa Holland | 17.73% | 2,256 | |||||||||
| SDLP | Cormac Boomer* | 13.01% | 1,655 | 1,890.43 | 1,897.72 | 1,900.42 | 1,903.42 | 1,958.24 | 2,028.22 | 2,161.22 | ||
| Alliance | Pip Glendinning | 7.32% | 931 | 947.38 | 949.9 | 951.16 | 955.16 | 958.73 | 994.31 | 1,334.43 | 1,805.43 | |
| Sinn Féin | Mairtin O'Muilleoir | 8.01% | 1,031 | 1,034.25 | 1,214.16 | 1,334.58 | 1,339.82 | 1,410.1 | 1,440.06 | 1,461.64 | 1,561.64 | |
| SDLP | Mary Muldoon* | 6.28% | 799 | 834.36 | 840.84 | 843.36 | 850.36 | 903.78 | 940.23 | 1,035.15 | ||
| Workers' Party | Gerald McCann | 3.03% | 386 | 389.77 | 390.67 | 391.63 | 405.76 | 413.51 | 463.37 | |||
| DUP | Irene Lewis | 2.92% | 372 | 372.39 | 372.39 | 372.51 | 372.6 | 372.6 | 374.6 | |||
| Labour and Trade Union | Michael Duffy | 1.87% | 238 | 243.2 | 244.82 | 246.14 | 255.14 | 273.81 | ||||
| People's Democracy | John McAnulty* | 1.03% | 131 | 131.91 | 137.67 | 140.73 | 146 | |||||
| SDLP | Peter Prendiville | 0.57% | 72 | 87.86 | 88.04 | 88.28 | 90.5 | |||||
| Communist | Kevin McCorry | 0.47% | 60 | 60.39 | 61.11 | 61.17 | ||||||
| Electorate: 23,327 Valid: 12,721 (54.53%) Spoilt: 331 Quota: 2,121 Turnout: 13,052 (55.95%) | ||||||||||||
See also
References
- "Ward Information for Andersonstown ward 95GG01". NISRA. Retrieved 22 December 2013.
- "Ward Information for Falls Park ward 95GG22". NISRA. Retrieved 22 December 2013.
- "Ward Information for Glen Road ward 95GG25". NISRA. Retrieved 22 December 2013.
- "Ward Information for Glencolin ward 95GG27". NISRA. Retrieved 22 December 2013.
- "Ward Information for Ladybrook ward 95GG31". NISRA. Retrieved 22 December 2013.
- "Upper Falls Result Sheet" (PDF). EONI. Retrieved 8 July 2021.
- "Local Government Results 2005". EONI. Retrieved 8 July 2021.
- "Local Government Results 2001". EONI. Retrieved 8 July 2021.
- "Local Government Results 1997". EONI. Retrieved 8 July 2021.
- "Local Government Results 1993". EONI. Retrieved 8 July 2021.
- "Local Government Results 1989". EONI. Retrieved 8 July 2021.
- "Local Government Results 1985". EONI. Retrieved 8 July 2021.
Places adjacent to Upper Falls (District Electoral Area) | |
|---|---|