Crisp County, Georgia
Crisp County is a county located in the central portion of the U.S. state of Georgia. As of the 2020 census, the population was 20,128.[1] The county seat is Cordele.[2] The county was created on August 17, 1905, from Dooly County and named for Georgia Congressman Charles Frederick Crisp.[3][4]
Crisp County | |
|---|---|
.JPG.webp) Crisp County Courthouse in Cordele | |
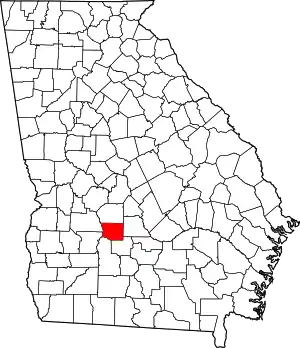 Location within the U.S. state of Georgia | |
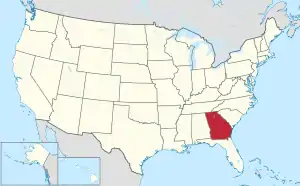 Georgia's location within the U.S. | |
| Coordinates: 31°56′N 83°46′W | |
| Country | |
| State | |
| Founded | 1905 |
| Named for | Charles Frederick Crisp |
| Seat | Cordele |
| Largest city | Cordele |
| Area | |
| • Total | 281 sq mi (730 km2) |
| • Land | 273 sq mi (710 km2) |
| • Water | 8.4 sq mi (22 km2) 3.0% |
| Population (2020) | |
| • Total | 20,128 |
| • Density | 74/sq mi (29/km2) |
| Time zone | UTC−5 (Eastern) |
| • Summer (DST) | UTC−4 (EDT) |
| Congressional district | 2nd |
| Website | www |
Crisp County comprises the Cordele, GA Micropolitan Statistical Area.
Geography
According to the U.S. Census Bureau, the county has a total area of 281 square miles (730 km2), of which 273 square miles (710 km2) is land and 8.4 square miles (22 km2) (3.0%) is water.[5]
The western two-thirds of Crisp County, bordered on the east by a line from south of Arabi running northeast, is located in the Middle Flint River sub-basin of the ACF River Basin (Apalachicola-Chattahoochee-Flint River Basin). The eastern third of the county is located in the Alapaha River sub-basin of the Suwannee River.[6]
Major highways
Adjacent counties
- Dooly County (north)
- Wilcox County (east)
- Turner County (southeast)
- Worth County (southwest)
- Lee County (west)
- Sumter County (west)
Demographics
| Census | Pop. | Note | %± |
|---|---|---|---|
| 1910 | 16,423 | — | |
| 1920 | 18,914 | 15.2% | |
| 1930 | 17,343 | −8.3% | |
| 1940 | 17,540 | 1.1% | |
| 1950 | 17,663 | 0.7% | |
| 1960 | 17,768 | 0.6% | |
| 1970 | 18,087 | 1.8% | |
| 1980 | 19,489 | 7.8% | |
| 1990 | 20,011 | 2.7% | |
| 2000 | 21,996 | 9.9% | |
| 2010 | 23,439 | 6.6% | |
| 2020 | 20,128 | −14.1% | |
| U.S. Decennial Census[7] 1790-1960[8] 1900-1990[9] 1990-2000[10] 2010-2019[11] | |||
2000 census
As of the census[12] of 2000, there were 21,996 people, 8,337 households, and 5,869 families living in the county. The population density was 80 people per square mile (31 people/km2). There were 9,559 housing units at an average density of 35 units per square mile (14 units/km2). The racial makeup of the county was 54.07% White, 43.40% Black or African American, 0.15% Native American, 0.68% Asian, 0.03% Pacific Islander, 0.98% from other races, and 0.68% from two or more races. 1.74% of the population were Hispanic or Latino of any race.
There were 8,337 households, out of which 34.80% had children under the age of 18 living with them, 44.80% were married couples living together, 21.60% had a female householder with no husband present, and 29.60% were non-families. 26.10% of all households were made up of individuals, and 11.10% had someone living alone who was 65 years of age or older. The average household size was 2.58 and the average family size was 3.10.
In the county, the population was spread out, with 29.00% under the age of 18, 9.20% from 18 to 24, 27.00% from 25 to 44, 21.80% from 45 to 64, and 13.00% who were 65 years of age or older. The median age was 34 years. For every 100 females there were 88.70 males. For every 100 females age 18 and over, there were 84.00 males.
The median income for a household in the county was $26,547, and the median income for a family was $32,747. Males had a median income of $28,595 versus $19,393 for females. The per capita income for the county was $14,695. About 24.60% of families and 29.30% of the population were below the poverty line, including 41.80% of those under age 18 and 24.00% of those age 65 or over.
2010 census
As of the 2010 United States Census, there were 23,439 people, 9,079 households, and 6,295 families living in the county.[13] The population density was 86.0 inhabitants per square mile (33.2/km2). There were 10,734 housing units at an average density of 39.4 units per square mile (15.2 units/km2).[14] The racial makeup of the county was 53.3% white, 43.0% black or African American, 0.8% Asian, 0.1% American Indian, 1.8% from other races, and 1.0% from two or more races. Those of Hispanic or Latino origin made up 3.2% of the population.[13] In terms of ancestry, 9.7% were Irish, 9.3% were American, and 7.8% were English.[15]
Of the 9,079 households, 34.4% had children under the age of 18 living with them, 42.7% were married couples living together, 21.3% had a female householder with no husband present, 30.7% were non-families, and 26.8% of all households were made up of individuals. The average household size was 2.53 and the average family size was 3.04. The median age was 38.1 years.[13]
The median income for a household in the county was $29,960 and the median income for a family was $41,616. Males had a median income of $35,290 versus $25,932 for females. The per capita income for the county was $17,187. About 24.0% of families and 29.1% of the population were below the poverty line, including 47.9% of those under age 18 and 16.9% of those age 65 or over.[16]
2020 census
| Race | Num. | Perc. |
|---|---|---|
| White (non-Hispanic) | 9,892 | 49.15% |
| Black or African American (non-Hispanic) | 8,821 | 43.82% |
| Native American | 18 | 0.09% |
| Asian | 180 | 0.89% |
| Pacific Islander | 4 | 0.02% |
| Other/Mixed | 579 | 2.88% |
| Hispanic or Latino | 634 | 3.15% |
As of the 2020 United States census, there were 20,128 people, 8,585 households, and 5,712 families residing in the county.
Education
Politics
| Year | Republican | Democratic | Third party | |||
|---|---|---|---|---|---|---|
| No. | % | No. | % | No. | % | |
| 2020 | 4,985 | 62.03% | 2,982 | 37.11% | 69 | 0.86% |
| 2016 | 4,549 | 60.26% | 2,837 | 37.58% | 163 | 2.16% |
| 2012 | 4,182 | 56.51% | 3,167 | 42.80% | 51 | 0.69% |
| 2008 | 4,424 | 58.56% | 3,085 | 40.84% | 45 | 0.60% |
| 2004 | 3,865 | 61.80% | 2,357 | 37.69% | 32 | 0.51% |
| 2000 | 3,285 | 58.57% | 2,268 | 40.44% | 56 | 1.00% |
| 1996 | 2,321 | 43.83% | 2,504 | 47.28% | 471 | 8.89% |
| 1992 | 2,253 | 39.46% | 2,610 | 45.72% | 846 | 14.82% |
| 1988 | 2,916 | 62.94% | 1,690 | 36.48% | 27 | 0.58% |
| 1984 | 2,895 | 57.63% | 2,128 | 42.37% | 0 | 0.00% |
| 1980 | 1,861 | 34.80% | 3,403 | 63.64% | 83 | 1.55% |
| 1976 | 1,328 | 26.17% | 3,747 | 73.83% | 0 | 0.00% |
| 1972 | 3,623 | 84.16% | 682 | 15.84% | 0 | 0.00% |
| 1968 | 935 | 17.90% | 1,017 | 19.47% | 3,271 | 62.63% |
| 1964 | 3,337 | 65.52% | 1,756 | 34.48% | 0 | 0.00% |
| 1960 | 963 | 28.94% | 2,365 | 71.06% | 0 | 0.00% |
| 1956 | 835 | 24.84% | 2,526 | 75.16% | 0 | 0.00% |
| 1952 | 949 | 30.96% | 2,116 | 69.04% | 0 | 0.00% |
| 1948 | 221 | 11.22% | 1,225 | 62.18% | 524 | 26.60% |
| 1944 | 217 | 15.32% | 1,199 | 84.68% | 0 | 0.00% |
| 1940 | 129 | 10.91% | 1,049 | 88.75% | 4 | 0.34% |
| 1936 | 79 | 7.12% | 1,029 | 92.70% | 2 | 0.18% |
| 1932 | 10 | 1.35% | 725 | 97.97% | 5 | 0.68% |
| 1928 | 402 | 43.46% | 523 | 56.54% | 0 | 0.00% |
| 1924 | 21 | 4.41% | 439 | 92.23% | 16 | 3.36% |
| 1920 | 83 | 12.81% | 565 | 87.19% | 0 | 0.00% |
| 1916 | 100 | 14.68% | 577 | 84.73% | 4 | 0.59% |
| 1912 | 45 | 6.42% | 644 | 91.87% | 12 | 1.71% |
See also
References
- "Census - Geography Profile: Crisp County, Georgia". United States Census Bureau. Retrieved December 26, 2022.
- "Find a County". National Association of Counties. Archived from the original on May 31, 2011. Retrieved June 7, 2011.
- "Crisp County, Georgia | Government For The People". www.crispcounty.com. Retrieved March 19, 2018.
- Krakow, Kenneth K. (1975). Georgia Place-Names: Their History and Origins (PDF). Macon, GA: Winship Press. p. 54. ISBN 0-915430-00-2. Archived (PDF) from the original on July 10, 2003.
- "US Gazetteer files: 2010, 2000, and 1990". United States Census Bureau. February 12, 2011. Retrieved April 23, 2011.
- "Georgia Soil and Water Conservation Commission Interactive Mapping Experience". Georgia Soil and Water Conservation Commission. Retrieved November 24, 2015.
- "U.S. Decennial Census". United States Census Bureau. Retrieved June 20, 2014.
- "Historical Census Browser". University of Virginia Library. Retrieved June 20, 2014.
- "Population of Counties by Decennial Census: 1900 to 1990". United States Census Bureau. Retrieved June 20, 2014.
- "Census 2000 PHC-T-4. Ranking Tables for Counties: 1990 and 2000" (PDF). United States Census Bureau. Archived (PDF) from the original on March 27, 2010. Retrieved June 20, 2014.
- "State & County QuickFacts". United States Census Bureau. Archived from the original on February 21, 2016. Retrieved February 15, 2014.
- "U.S. Census website". United States Census Bureau. Retrieved May 14, 2011.
- "DP-1 Profile of General Population and Housing Characteristics: 2010 Demographic Profile Data". United States Census Bureau. Archived from the original on February 13, 2020. Retrieved December 27, 2015.
- "Population, Housing Units, Area, and Density: 2010 - County". United States Census Bureau. Archived from the original on February 13, 2020. Retrieved December 27, 2015.
- "DP02 SELECTED SOCIAL CHARACTERISTICS IN THE UNITED STATES – 2006-2010 American Community Survey 5-Year Estimates". United States Census Bureau. Archived from the original on February 13, 2020. Retrieved December 27, 2015.
- "DP03 SELECTED ECONOMIC CHARACTERISTICS – 2006-2010 American Community Survey 5-Year Estimates". United States Census Bureau. Archived from the original on February 13, 2020. Retrieved December 27, 2015.
- "Explore Census Data". data.census.gov. Retrieved December 15, 2021.
- Leip, David. "Dave Leip's Atlas of U.S. Presidential Elections". uselectionatlas.org. Retrieved March 19, 2018.
External links
- http://www.crispcounty.com
- Crisp County historical marker
Places adjacent to Crisp County, Georgia | ||||||||||||||||
|---|---|---|---|---|---|---|---|---|---|---|---|---|---|---|---|---|
| ||||||||||||||||
Municipalities and communities of Crisp County, Georgia, United States | ||
|---|---|---|
| City | Map of Georgia highlighting Crisp County | |
| Town | ||
| CDP | ||
| Other unincorporated communities | ||