Courtenay—Alberni
Courtenay—Alberni is a federal electoral district in British Columbia, Canada. It is around the latitudinal centre of Vancouver Island. It encompasses a portion of B.C. formerly included in the electoral districts of Nanaimo—Alberni and Vancouver Island North.[3]
.svg.png.webp) Courtenay—Alberni in relation to other electoral districts in the Vancouver Island area | |||
| Federal electoral district | |||
| Legislature | House of Commons | ||
| MP |
New Democratic | ||
| District created | 2013 | ||
| First contested | 2015 | ||
| Last contested | 2021 | ||
| District webpage | profile, map | ||
| Demographics | |||
| Population (2011)[1] | 110,391 | ||
| Electors (2019) | 100,510 | ||
| Area (km²)[2] | 8,571 | ||
| Pop. density (per km²) | 12.9 | ||
| Census division(s) | Alberni-Clayoquot, Comox Valley, Nanaimo, Powell River | ||
| Census subdivision(s) | Ahahswinis 1, Alberni 2, Alberni-Clayoquot A, Alberni-Clayoquot B, Alberni-Clayoquot C, Alberni-Clayoquot D, Alberni-Clayoquot E, Alberni-Clayoquot F, Anacla 12, Clakamucus 2, Comox Valley A, Courtenay, Cumberland, Elhlateese 2, Esowista 3, Hesquiat 1, Ittatsoo 1, Klehkoot 2, Macoah 1, Marktosis 15, Nanaimo E, Nanaimo F, Nanaimo G, Nanaimo H, Numukamis 1, Opitsat 1, Parksville, Port Alberni, Powell River E, Qualicum, Qualicum Beach, Refuge Cove 6, Sachsa 4, Tin Wis 11, Tofino, Tsahaheh 1, Ucluelet | ||
Courtenay—Alberni was created by the 2012 federal electoral boundaries redistribution and was legally defined in the 2013 representation order. It came into effect upon the call of the 42nd Canadian federal election, polling for which took place on October 2015.[4]
Demographics
| Panethnic group |
2021[5] | 2016[6] | 2011[7] | |||||||||||
|---|---|---|---|---|---|---|---|---|---|---|---|---|---|---|
| Pop. | % | Pop. | % | Pop. | % | |||||||||
| European[lower-alpha 1] | 104,325 | 85.24% | 96,505 | 86.19% | 95,360 | 88.44% | ||||||||
| Indigenous | 11,625 | 9.5% | 10,475 | 9.36% | 8,585 | 7.96% | ||||||||
| East Asian[lower-alpha 2] | 1,835 | 1.5% | 1,735 | 1.55% | 1,460 | 1.35% | ||||||||
| Southeast Asian[lower-alpha 3] | 1,665 | 1.36% | 1,105 | 0.99% | 870 | 0.81% | ||||||||
| South Asian | 1,320 | 1.08% | 1,110 | 0.99% | 615 | 0.57% | ||||||||
| African | 570 | 0.47% | 520 | 0.46% | 330 | 0.31% | ||||||||
| Latin American | 465 | 0.38% | 170 | 0.15% | 290 | 0.27% | ||||||||
| Middle Eastern[lower-alpha 4] | 190 | 0.16% | 80 | 0.07% | 60 | 0.06% | ||||||||
| Other[lower-alpha 5] | 410 | 0.33% | 275 | 0.25% | 260 | 0.24% | ||||||||
| Total responses | 122,395 | 97.83% | 111,970 | 97.67% | 107,825 | 97.73% | ||||||||
| Total population | 125,116 | 100% | 114,647 | 100% | 110,324 | 100% | ||||||||
| Notes: Totals greater than 100% due to multiple origin responses. Demographics based on 2012 Canadian federal electoral redistribution riding boundaries. | ||||||||||||||
- According to the Canada 2011 Census[8][9]
Languages: 90.8% English, 2.2% French, 1.8% German
Religions: 45.1% Christian (11.9% Catholic, 8.3% United Church, 7.7% Anglican, 2.5% Baptist, 2.0% Lutheran, 1.3% Presbyterian, 1.2% Pentecostal, 10.2% Other), 3.0% Other, 51.9% No religion
Median income (2010): $26,754
Average income (2010): $34,319
Main industries: Retail trade (14.4% of labour force), Health care and social assistance (12.1%)
Members of Parliament
This riding has elected the following members of the House of Commons of Canada:
| Parliament | Years | Member | Party | |
|---|---|---|---|---|
| Courtenay—Alberni Riding created from Nanaimo—Alberni and Vancouver Island North |
||||
| 42nd | 2015–2019 | Gord Johns | New Democratic | |
| 43rd | 2019–2021 | |||
| 44th | 2021–present | |||
Election results
| 2021 Canadian federal election | ||||||||
|---|---|---|---|---|---|---|---|---|
| Party | Candidate | Votes | % | ±% | Expenditures | |||
| New Democratic | Gord Johns | 30,612 | 44.2 | +3.0 | $97,029.16 | |||
| Conservative | Mary Lee | 22,181 | 32.0 | -1.1 | $108,059.72 | |||
| Liberal | Susan Farlinger | 9,276 | 13.4 | +1.5 | $37,061.04 | |||
| Green | Susanne Lawson | 3,590 | 5.2 | -8.3 | $9,378.63 | |||
| People's | Robert Eppich | 3,467 | 5.0 | N/A | $6,474.87 | |||
| Marxist–Leninist | Barbara Biley | 124 | 0.2 | ±0.0 | $0.00 | |||
| Total valid votes/Expense limit | 69,250 | 99.7 | – | $131.260.27 | ||||
| Total rejected ballots | 215 | 0.3 | ||||||
| Turnout | 69,465 | 65.8 | ||||||
| Eligible voters | 105,605 | |||||||
| New Democratic hold | Swing | +2.1 | ||||||
| Source: Elections Canada[10] | ||||||||
| 2019 Canadian federal election | ||||||||
|---|---|---|---|---|---|---|---|---|
| Party | Candidate | Votes | % | ±% | Expenditures | |||
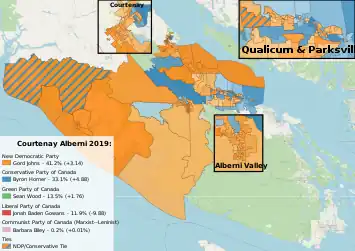
| New Democratic | Gord Johns | 29,790 | 41.21 | +3.16 | $120,371.26 | |||
| Conservative | Byron Horner | 23,936 | 33.12 | +4.89 | $93,314.71 | |||
| Green | Sean Wood | 9,762 | 13.51 | +1.76 | $15,677.21 | |||
| Liberal | Jonah Baden Gowans | 8,620 | 11.93 | -9.85 | $13,538.18 | |||
| Marxist–Leninist | Barbara Biley | 172 | 0.24 | +0.04 | ||||
| Total valid votes/expense limit | 72,280 | 99.51 | ||||||
| Total rejected ballots | 359 | 0.49 | +0.23 | |||||
| Turnout | 72,639 | 71.40 | -4.50 | |||||
| Eligible voters | 101,730 | |||||||
| New Democratic hold | Swing | -0.87 | ||||||
| Source: Elections Canada[11][12] | ||||||||
| 2015 Canadian federal election | ||||||||
|---|---|---|---|---|---|---|---|---|
| Party | Candidate | Votes | % | ±% | Expenditures | |||
| New Democratic | Gord Johns | 26,582 | 38.06 | -2.66 | $124,072.44 | |||
| Conservative | John Duncan | 19,714 | 28.22 | -16.66 | $92,251.34 | |||
| Liberal | Carrie Powell-Davidson | 15,212 | 21.78 | +15.06 | $32,002.88 | |||
| Green | Glenn Sollitt | 8,201 | 11.74 | +4.89 | $124,891.17 | |||
| Marxist–Leninist | Barbara Biley | 140 | 0.20 | – | – | |||
| Total valid votes/expense limit | 69,849 | 99.74 | $231,958.67 | |||||
| Total rejected ballots | 185 | 0.26 | – | |||||
| Turnout | 70,034 | 75.90 | – | |||||
| Eligible voters | 92,266 | |||||||
| New Democratic notional gain from Conservative | Swing | -7.00 | ||||||
| This riding was created from Nanaimo—Alberni and Vancouver Island North, both of which elected a Conservative candidate in the last election. John Duncan was the incumbent from Vancouver Island North. | ||||||||
| Source: Elections Canada[13][14][15] | ||||||||
| 2011 federal election redistributed results[16] | |||
|---|---|---|---|
| Party | Vote | % | |
| Conservative | 25,797 | 44.89 | |
| New Democratic | 23,400 | 40.72 | |
| Green | 3,935 | 6.85 | |
| Liberal | 3,860 | 6.72 | |
| Others | 480 | 0.84 | |
Notes
- Statistic includes all persons that did not make up part of a visible minority or an indigenous identity.
- Statistic includes total responses of "Chinese", "Korean", and "Japanese" under visible minority section on census.
- Statistic includes total responses of "Filipino" and "Southeast Asian" under visible minority section on census.
- Statistic includes total responses of "West Asian" and "Arab" under visible minority section on census.
- Statistic includes total responses of "Visible minority, n.i.e." and "Multiple visible minorities" under visible minority section on census.
References
- Statistics Canada: 2011
- Statistics Canada: 2011
- Final Report – British Columbia
- Timeline for the Redistribution of Federal Electoral Districts
- Government of Canada, Statistics Canada (October 26, 2022). "Census Profile, 2021 Census of Population". www12.statcan.gc.ca. Retrieved February 14, 2023.
- Government of Canada, Statistics Canada (October 27, 2021). "Census Profile, 2016 Census". www12.statcan.gc.ca. Retrieved February 14, 2023.
- Government of Canada, Statistics Canada (November 27, 2015). "NHS Profile". www12.statcan.gc.ca. Retrieved February 14, 2023.
- "Statistics Canada: 2011 Census Profile". February 8, 2012.
- "2011 National Household Survey Profile - Federal electoral district (2013 Representation Order)". May 8, 2013.
- "List of confirmed candidates – September 20, 2021 Federal Election". Elections Canada. Retrieved September 2, 2021.
- "List of confirmed candidates". Elections Canada. Retrieved October 4, 2019.
- "Official Voting Results". Elections Canada. Retrieved August 7, 2021.
- Elections Canada – Confirmed candidates for Courtenay—Alberni, 30 September 2015
- Official Voting Results - Courtenay—Alberni
- "Elections Canada – Preliminary Election Expenses Limits for Candidates". Archived from the original on August 15, 2015.
- Pundits' Guide to Canadian Elections