Dillon County, South Carolina
Dillon County is a county located in the U.S. state of South Carolina. As of the 2020 census, the county's population was 28,292.[2] The county seat is Dillon.[3]
Dillon County | |
|---|---|
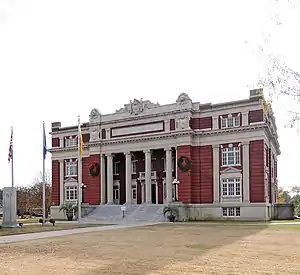 | |
 Flag  Seal | |
| Nickname: The Golden Land | |
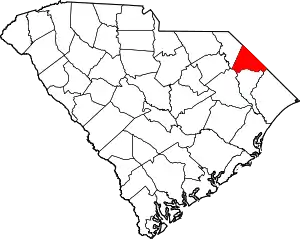 Location within the U.S. state of South Carolina | |
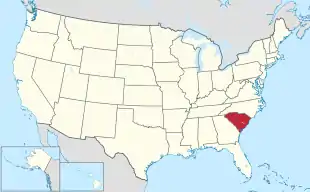 South Carolina's location within the U.S. | |
| Coordinates: 34°23′N 79°23′W | |
| Country | |
| State | |
| Founded | 1910 |
| Named for | James W. Dillon[1] |
| Seat | Dillon |
| Largest community | Dillon |
| Area | |
| • Total | 406.82 sq mi (1,053.7 km2) |
| • Land | 405.07 sq mi (1,049.1 km2) |
| • Water | 1.75 sq mi (4.5 km2) 0.43% |
| Population (2020) | |
| • Total | 28,292 |
| • Estimate (2022) | 27,738 |
| • Density | 69.84/sq mi (26.97/km2) |
| Time zone | UTC−5 (Eastern) |
| • Summer (DST) | UTC−4 (EDT) |
| Congressional district | 7th |
| Website | www |
History
Founded in 1910 from a portion of Marion County, both Dillon County and the city of Dillon were named for prosperous local citizen James W. Dillon (1826–1913), an Irishman who settled there and led a campaign to bring the railroad into the community. The result of this effort was the construction of the Wilson Short Cut Railroad, which later became part of the Atlantic Coast Line Railroad. It stimulated greater prosperity directly linking Dillon County to the national network of railroads.[4]
Geography
According to the U.S. Census Bureau, the county has a total area of 406.82 square miles (1,053.7 km2), of which 405.07 square miles (1,049.1 km2) is land and 1.75 square miles (4.5 km2) (0.43%) is water.[5] It is the fifth-smallest county in South Carolina by area.
State and local protected areas/sites
- Bass Community Park
- Dillon County Museum
- Little Pee Dee State Park
- Little Pee Dee State Park Bay Heritage Preserve[6]
Major water bodies
- Cud Swamp
- Great Pee Dee River
- Little Pee Dee River
- Lumber River
- Maidendown Swamp
- Reedy Creek
Adjacent counties
- Robeson County, North Carolina – north
- Columbus County, North Carolina – north
- Horry County – east
- Marion County – south
- Florence County – southwest
- Marlboro County – west
Major highways
Major infrastructure
- Dillon County Airport
- Dillon Station
- Inland Port Dillon, major rail depot in the county
Demographics
| Census | Pop. | Note | %± |
|---|---|---|---|
| 1910 | 22,615 | — | |
| 1920 | 25,278 | 11.8% | |
| 1930 | 25,733 | 1.8% | |
| 1940 | 29,625 | 15.1% | |
| 1950 | 30,930 | 4.4% | |
| 1960 | 30,584 | −1.1% | |
| 1970 | 28,838 | −5.7% | |
| 1980 | 31,083 | 7.8% | |
| 1990 | 29,114 | −6.3% | |
| 2000 | 30,722 | 5.5% | |
| 2010 | 32,062 | 4.4% | |
| 2020 | 28,292 | −11.8% | |
| 2022 (est.) | 27,738 | [2] | −2.0% |
| U.S. Decennial Census[7] 1790–1960[8] 1900–1990[9] 1990–2000[10] 2010[11] 2020[2] | |||
2020 census
| Race | Num. | Perc. |
|---|---|---|
| White (non-Hispanic) | 12,987 | 45.9% |
| Black or African American (non-Hispanic) | 12,709 | 44.92% |
| Native American | 603 | 2.13% |
| Asian | 63 | 0.22% |
| Pacific Islander | 1 | 0.0% |
| Other/Mixed | 1,073 | 3.79% |
| Hispanic or Latino | 856 | 3.03% |
As of the 2020 United States census, there were 28,292 people, 11,029 households, and 7,016 families residing in the county.
2010 census
At the 2010 census, there were 32,062 people, 11,923 households, and 8,342 families living in the county.[13][11] The population density was 79.2 inhabitants per square mile (30.6/km2). There were 13,742 housing units at an average density of 33.9 per square mile (13.1/km2).[14] The racial makeup of the county was 48.0% white, 46.1% black or African American, 2.5% American Indian, 0.2% Asian, 1.5% from other races, and 1.6% from two or more races. Those of Hispanic or Latino origin made up 2.6% of the population.[13] In terms of ancestry, 13.5% were American, 6.5% were English, and 5.4% were Irish.[15]
Of the 11,923 households, 36.5% had children under the age of 18 living with them, 40.2% were married couples living together, 23.9% had a female householder with no husband present, 30.0% were non-families, and 26.5% of all households were made up of individuals. The average household size was 2.65 and the average family size was 3.20. The median age was 36.7 years.[13]
The median income for a household in the county was $26,818 and the median income for a family was $34,693. Males had a median income of $31,973 versus $22,100 for females. The per capita income for the county was $14,684. About 26.2% of families and 30.5% of the population were below the poverty line, including 43.8% of those under age 18 and 23.7% of those age 65 or over.[16]
2000 census
At the 2000 census,[17] there were 30,722 people, 11,199 households, and 8,063 families living in the county. The population density was 76 people per square mile (29 people/km2). There were 12,679 housing units at an average density of 31 per square mile (12/km2). The racial makeup of the county was 47% White, 49% Black or African American, 2.21% Native American, 0.34% Asian, 0.03% Pacific Islander, 0.99% from other races, and 0.70% from two or more races. 1.75% of the population were Hispanic or Latino of any race.
There were 11,199 households, out of which 34.60% had children under the age of 18 living with them, 44.80% were married couples living together, 22.30% had a female householder with no husband present, and 28.00% were non-families. 25.10% of all households were made up of individuals, and 9.90% had someone living alone who was 65 years of age or older. The average household size was 2.71 and the average family size was 3.24.
In the county, the population was spread out, with 29.10% under the age of 18, 9.50% from 18 to 24, 27.50% from 25 to 44, 22.40% from 45 to 64, and 11.50% who were 65 years of age or older. The median age was 34 years. For every 100 females there were 87.40 males. For every 100 females age 18 and over, there were 81.60 males.
The median income for a household in the county was $26,630, and the median income for a family was $32,690. Males had a median income of $26,908 versus $18,007 for females. The per capita income for the county was $13,272. About 19.40% of families and 24.20% of the population were below the poverty line, including 33.30% of those under age 18 and 26.60% of those age 65 or over.
Government and politics
| Year | Republican | Democratic | Third party | |||
|---|---|---|---|---|---|---|
| No. | % | No. | % | No. | % | |
| 2020 | 6,582 | 50.24% | 6,436 | 49.13% | 83 | 0.63% |
| 2016 | 5,637 | 48.19% | 5,834 | 49.87% | 227 | 1.94% |
| 2012 | 5,427 | 41.63% | 7,523 | 57.71% | 85 | 0.65% |
| 2008 | 5,874 | 43.78% | 7,408 | 55.21% | 135 | 1.01% |
| 2004 | 4,301 | 46.57% | 4,832 | 52.32% | 102 | 1.10% |
| 2000 | 3,975 | 44.22% | 4,930 | 54.84% | 85 | 0.95% |
| 1996 | 2,774 | 39.29% | 3,992 | 56.54% | 295 | 4.18% |
| 1992 | 3,575 | 38.07% | 4,953 | 52.75% | 862 | 9.18% |
| 1988 | 3,793 | 53.66% | 3,251 | 45.99% | 25 | 0.35% |
| 1984 | 4,646 | 57.71% | 3,360 | 41.74% | 44 | 0.55% |
| 1980 | 3,385 | 42.31% | 4,518 | 56.48% | 97 | 1.21% |
| 1976 | 2,527 | 33.08% | 5,089 | 66.62% | 23 | 0.30% |
| 1972 | 4,364 | 72.32% | 1,604 | 26.58% | 66 | 1.09% |
| 1968 | 2,396 | 35.73% | 2,178 | 32.48% | 2,132 | 31.79% |
| 1964 | 2,742 | 49.72% | 2,773 | 50.28% | 0 | 0.00% |
| 1960 | 1,439 | 35.17% | 2,652 | 64.83% | 0 | 0.00% |
| 1956 | 313 | 10.49% | 1,879 | 62.97% | 792 | 26.54% |
| 1952 | 1,473 | 48.28% | 1,578 | 51.72% | 0 | 0.00% |
| 1948 | 24 | 1.33% | 808 | 44.89% | 968 | 53.78% |
| 1944 | 27 | 2.69% | 864 | 86.06% | 113 | 11.25% |
| 1940 | 25 | 2.80% | 868 | 97.20% | 0 | 0.00% |
| 1936 | 5 | 0.45% | 1,104 | 99.55% | 0 | 0.00% |
| 1932 | 20 | 1.96% | 998 | 98.04% | 0 | 0.00% |
| 1928 | 21 | 3.63% | 558 | 96.37% | 0 | 0.00% |
| 1924 | 3 | 0.50% | 598 | 99.50% | 0 | 0.00% |
| 1920 | 5 | 0.50% | 1,003 | 99.50% | 0 | 0.00% |
| 1916 | 0 | 0.00% | 972 | 100.00% | 0 | 0.00% |
| 1912 | 2 | 0.29% | 680 | 98.12% | 11 | 1.59% |
Attractions
- Dillon County Museum
- Little Pee Dee State Park
- South of the Border
Communities
Cities
- Dillon (county seat and largest community)
Census-designated places
Other unincorporated communities
- Bass Crossroads
- Berrys Crossroads
- Bingham
- Bronson Crossroads
- Bunker Hill
- Carmichael Crossroads
- Carolina
- Carter Landing
- Centerville
- Cotton Valley
- Dalcho
- Dothan
- Dunbarton
- Five Forks
- Fork
- Forrest Hills
- Gaddys Crossroads
- Gaddys Mill
- Galavon
- Hayestown
- High Hill Crossroads
- Jacksonville
- Judson
- Kemper
- Kentyre
- Linkside
- Mallory
- Mallory Beach
- Manning Crossroads
- May Hilltop
- McCormick Crossroads
- Minturn
- Mount Calvary
- Newtown
- Oak Grove
- Oakland Crossroads
- Oliver Crossroads
- Pittman Corner
- Riverdale
- Selma
- Sinclair Crossroads
- South of the Border
- Squires
- Squires Curve
- Temperance Hill
See also
References
- "Dillon county, South Carolina, United States". www.britannica.com. Retrieved June 13, 2022.
- "U.S. Census Bureau QuickFacts: Dillon County, South Carolina". www.census.gov. Retrieved June 12, 2022.
- "Find a County". National Association of Counties. Archived from the original on May 31, 2011. Retrieved June 7, 2011.
- "Dillon County". Archived from the original on January 9, 2010. Retrieved January 16, 2010.
- "2020 County Gazetteer Files – South Carolina". United States Census Bureau. August 23, 2022. Retrieved September 10, 2023.
- "SCDNR Public Lands". www2.dnr.sc.gov. Retrieved April 1, 2023.
- "U.S. Decennial Census". United States Census Bureau. Retrieved March 17, 2015.
- "Historical Census Browser". University of Virginia Library. Retrieved March 17, 2015.
- Forstall, Richard L., ed. (March 27, 1995). "Population of Counties by Decennial Census: 1900 to 1990". United States Census Bureau. Retrieved March 17, 2015.
- "Census 2000 PHC-T-4. Ranking Tables for Counties: 1990 and 2000" (PDF). United States Census Bureau. April 2, 2001. Archived (PDF) from the original on October 9, 2022. Retrieved March 17, 2015.
- "State & County QuickFacts". United States Census Bureau. Archived from the original on June 6, 2011. Retrieved November 23, 2013.
- "Explore Census Data". data.census.gov. Retrieved December 10, 2021.
- "DP-1 Profile of General Population and Housing Characteristics: 2010 Demographic Profile Data". United States Census Bureau. Archived from the original on February 13, 2020. Retrieved March 9, 2016.
- "Population, Housing Units, Area, and Density: 2010 - County". United States Census Bureau. Archived from the original on February 13, 2020. Retrieved March 9, 2016.
- "DP02 SELECTED SOCIAL CHARACTERISTICS IN THE UNITED STATES – 2006-2010 American Community Survey 5-Year Estimates". United States Census Bureau. Archived from the original on February 13, 2020. Retrieved March 9, 2016.
- "DP03 SELECTED ECONOMIC CHARACTERISTICS – 2006-2010 American Community Survey 5-Year Estimates". United States Census Bureau. Archived from the original on February 13, 2020. Retrieved March 9, 2016.
- "U.S. Census website". United States Census Bureau. Retrieved May 14, 2011.
- Leip, David. "Dave Leip's Atlas of U.S. Presidential Elections". uselectionatlas.org. Retrieved March 13, 2018.
Further reading
- Gregg, Alexander (1905). History of the Old Cheraws. State Company.
External links
 Geographic data related to Dillon County, South Carolina at OpenStreetMap
- Official website
- Dillon County history and images