Elections in Italy
National-level elections in Italy are called periodically to form a parliament consisting of two houses: the Chamber of Deputies (Camera dei Deputati) with 400 members; and the Senate of the Republic (Senato della Repubblica) with 200 elected members, plus a few appointed senators for life. Italy is a parliamentary republic: the President of the Republic is elected for a seven-year term by the two houses of Parliament in joint session, together with special electors appointed by the Regional Councils.
| Part of the Politics series |
 |
|---|
|
|
Italy had a mixed-member majoritarian system in place between 1993 and 2005.[1] The 2006 elections were the first elections conducted under a closed-list proportional system rather than a mixed system.[1]
The most recent Italian general election was held on 25 September 2022.
2022 election
The last general election was held on 25 September 2022
The centre-right coalition, in which Giorgia Meloni's Brothers of Italy emerged as the main political force, won an absolute majority of seats in the Chamber of Deputies and in the Senate of the Republic. The centre-left coalition, the anti-establishment Five Star Movement and the centrist Action - Italia Viva came in second, third and fourth respectively.
Overall results


| ||||||||||||||||
| Coalition | Party | Proportional | First-past-the-post | Aosta Valley | Overseas | Total seats | ||||||||||
|---|---|---|---|---|---|---|---|---|---|---|---|---|---|---|---|---|
| Votes | % | Seats | Votes | % | Seats | Votes | % | Seats | Votes | % | Seats | |||||
| Centre-right | Brothers of Italy | 7,302,517 | 26.00 | 69 | 12,300,244 | 43.79 | 49 | 16,016 | 28.80 | – | 281,949 | 26.00 | 1 | 119 | ||
| League | 2,464,005 | 8.77 | 23 | 42 | – | 1 | 66 | |||||||||
| Forza Italia | 2,278,217 | 8.11 | 22 | 23 | – | – | 45 | |||||||||
| Us Moderates | 255,505 | 0.91 | – | 7 | – | — | — | — | 7 | |||||||
| Centre-left | Democratic Party – IDP | 5,356,180 | 19.07 | 57 | 7,337,975 | 26.13 | 8 | — | — | — | 305,759 | 28.20 | 4 | 69 | ||
| Greens and Left Alliance | 1,018,669 | 3.63 | 11 | 1 | — | — | — | 52,994 | 4.89 | – | 12 | |||||
| More Europe | 793,961 | 2.83 | – | 2 | — | — | — | 29,971 | 2.76 | – | 2 | |||||
| Civic Commitment | 169,165 | 0.60 | – | 1 | — | — | — | 11,590 | 1.07 | – | 1 | |||||
| Five Star Movement | 4,333,972 | 15.43 | 41 | 4,333,972 | 15.43 | 10 | — | — | — | 93,338 | 8.61 | 1 | 52 | |||
| Action – Italia Viva | 2,186,669 | 7.79 | 21 | 2,186,669 | 7.79 | – | — | — | — | 60,499 | 5.58 | – | 21 | |||
| South Tyrolean People's Party – PATT | 117,010 | 0.42 | 1 | 117,010 | 0.42 | 2 | — | — | — | — | — | — | 3 | |||
| South calls North | 212,685 | 0.76 | – | 212,685 | 0.76 | 1 | — | — | — | — | — | — | 1 | |||
| Aosta Valley | — | — | — | — | — | — | 20,763 | 38.63 | 1 | — | — | — | 1 | |||
| Associative Movement of Italians Abroad | — | — | — | — | — | — | — | — | — | 141,356 | 13.04 | 1 | 1 | |||
| Others | 1,599,227 | 5.68 | – | 1,599,227 | 5.68 | – | 16,967 | 32.57 | – | 106,847 | 9.85 | – | – | |||
| Total | 28,087,782 | 100 | 245 | 28,087,782 | 100 | 146 | 53,746 | 100 | 1 | 1,084,303 | 100 | 8 | 400 | |||
Proportional and FPTP results
| Party | Votes | % | Seats | |||
|---|---|---|---|---|---|---|
| Brothers of Italy (FdI) | 7,301,303 | 25.98 | 69 | |||
| Democratic Party – IDP (PD–IDP) | 5,348,676 | 19.04 | 57 | |||
| Five Star Movement (M5S) | 4,335,494 | 15.43 | 41 | |||
| League (Lega) | 2,470,318 | 8.79 | 23 | |||
| Forza Italia (FI) | 2,279,266 | 8.11 | 22 | |||
| Action – Italia Viva (A–IV) | 2,186,505 | 7.78 | 21 | |||
| Greens and Left Alliance (AVS) | 1,021,808 | 3.64 | 11 | |||
| More Europe (+E) | 796,057 | 2.83 | – | |||
| Italexit for Italy (Italexit) | 534,950 | 1.90 | – | |||
| People's Union (UP) | 403,149 | 1.43 | – | |||
| Sovereign and Popular Italy (ISP) | 348,831 | 1.24 | – | |||
| Us Moderates (NM) | 254,127 | 0.91 | – | |||
| South calls North (ScN) | 212,954 | 0.76 | – | |||
| Vita (V) | 201,737 | 0.72 | – | |||
| Civic Commitment (IC) | 173,555 | 0.62 | – | |||
| South Tyrolean People's Party – PATT (SVP–PATT) | 117,032 | 0.42 | 1 | |||
| Us of the Centre – Europeanists (NDC–Eu) | 46,230 | 0.16 | – | |||
| Italian Communist Party (PCI) | 24,549 | 0.09 | – | |||
| Animalist Party – UCDL – 10VM (PAI–UCDL–10VM) | 21,451 | 0.08 | – | |||
| Alternative for Italy (APLI) | 17,137 | 0.06 | – | |||
| Party of Creative Madness (PFC) | 1,419 | 0.00 | – | |||
| Free (F) | 829 | 0.00 | – | |||
| Force of the People (FdP) | 819 | 0.00 | – | |||
| Total | 28,098,196 | 100.00 | 245 | |||
| Invalid / blank / unassigned votes | 1,286,915 | 4.38 | – | |||
| Total turnout | 29,385,111 | 63.85 | – | |||
| Registered voters | 46,021,956 | – | – | |||
| Source: Ministry of the Interior | ||||||
| Party or coalition | Votes | % | Seats | |||
|---|---|---|---|---|---|---|
| Centre-right coalition (CDX) | 12,305,014 | 43.79 | 121 | |||
| Centre-left coalition (CSX) | 7,340,096 | 26.12 | 12 | |||
| Five Star Movement (M5S) | 4,335,494 | 15.43 | 10 | |||
| Action – Italia Viva (A–IV) | 2,186,505 | 7.78 | – | |||
| Italexit for Italy (Italexit) | 534,950 | 1.90 | – | |||
| People's Union (UP) | 403,149 | 1.43 | – | |||
| Sovereign and Popular Italy (ISP) | 348,831 | 1.24 | – | |||
| South calls North (ScN) | 212,954 | 0.76 | 1 | |||
| Vita (V) | 201,737 | 0.72 | – | |||
| South Tyrolean People's Party – PATT (SVP–PATT) | 117,032 | 0.42 | 2 | |||
| Us of the Centre – Europeanists (NDC–Eu) | 46,230 | 0.16 | – | |||
| Italian Communist Party (PCI) | 24,549 | 0.09 | – | |||
| Animalist Party – UCDL – 10VM (PAI–UCDL–10VM) | 21,451 | 0.08 | – | |||
| Alternative for Italy (APLI) | 17,137 | 0.06 | – | |||
| Party of Creative Madness (PFC) | 1,419 | 0.00 | – | |||
| Free (F) | 829 | 0.00 | – | |||
| Force of the People (FdP) | 819 | 0.00 | – | |||
| Total | 28,098,196 | 100.00 | 146 | |||
| Invalid / blank / unassigned votes | 1,286,915 | 4.38 | – | |||
| Total turnout | 29,385,111 | 63.85 | – | |||
| Registered voters | 46,021,956 | – | – | |||
| Source: Ministry of the Interior | ||||||
Aosta Valley
The autonomous region of Aosta Valley in northwestern Italy elects one member to the Chamber of Deputies through a direct first-past-the-post election. Some parties that formed electoral coalitions in Italy might have opted to run against one another, or form different coalitions, in this particular region.[3][4]
| Candidate | Party | Votes | % | Result | |
|---|---|---|---|---|---|
| Franco Manes | Aosta Valley (VdA)[lower-alpha 1] | 20,763 | 38.63 | ||
| Emily Rini | Centre-right coalition (Lega–FI–NM–FdI) | 16,016 | 28.80 | ||
| Giovanni Girardini | Valdostan Renaissance | 6,398 | 11.90 | ||
| Erika Guichardaz | Open Aosta Valley (Open VdA)[lower-alpha 2] | 5,841 | 10.87 | ||
| Loredana Ronc | Sovereign and Popular Italy (ISP) | 2,302 | 4.28 | ||
| Loredana De Rosa | People's Union (UP) | 1,375 | 2.56 | ||
| Davide Ianni | Italian Communist Party (PCI) | 1,051 | 1.96 | ||
| Total | 53,746 | 100.00 | 1 | ||
| Invalid / blank / unassigned votes | 5,740 | 9.66 | – | ||
| Total turnout | 59,490 | 60.59 | – | ||
| Registered voters | 98,187 | – | – | ||
| Source: Ministry of the Interior | |||||
- Including Democratic Party (PD), Action (A), Italia Viva (IV), Valdostan Union (UV), Valdostan Alliance (AV), United Aosta Valley (VdAU), and Edelweiss (SA)
- Including Five Star Movement (M5S), Democratic Area (AD–GA), Environment Rights Equality (ADU), and Italian Left (SI)
Overseas constituencies
Eight members of the Chamber of Deputies are elected by Italians abroad. Two members are elected for North America and Central America (including most of the Caribbean), two members for South America (including Trinidad and Tobago), three members for Europe, and one member for the rest of the world (Africa, Asia, Oceania, and Antarctica). Voters in these regions select candidate lists and cast a preference vote for individual candidates. The seats are allocated by proportional representation. The electoral law allows for parties to form different coalitions on the lists abroad, compared to the lists in Italy; Forza Italia, the League, and Brothers of Italy formed a unified list for abroad constituencies.[5]
| Party | Votes | % | Seats | |||
|---|---|---|---|---|---|---|
| Democratic Party – IDP (PD–IDP) | 306,105 | 28.20 | 4 | |||
| League – Forza Italia – Brothers of Italy (Lega–FI–FdI) | 282,636 | 26.04 | 2 | |||
| Associative Movement of Italians Abroad (MAIE) | 141,440 | 13.03 | 1 | |||
| Five Star Movement (M5S) | 93,219 | 8.59 | 1 | |||
| South American Union of Italian Emigrants (USEI) | 73,389 | 6.76 | – | |||
| Action – Italia Viva (A–IV) | 60,456 | 5.57 | – | |||
| Greens and Left Alliance (AVS) | 52,962 | 4.88 | – | |||
| More Europe (+E) | 29,947 | 2.76 | – | |||
| Movement of Freedoms (MdL) | 18,348 | 1.69 | – | |||
| Italy of the South (IdM) | 15,442 | 1.42 | – | |||
| Civic Commitment (IC) | 11,608 | 1.07 | – | |||
| Total | 1,085,552 | 100.00 | 8 | |||
| Invalid / blank / unassigned votes | 164,929 | 13.19 | – | |||
| Total turnout | 1,250,481 | 26.36 | – | |||
| Registered voters | 4,743,980 | – | – | |||
| Source: Ministry of the Interior | ||||||
Overall results


| ||||||||||||||||||||
| Coalition | Party | Proportional | First-past-the-post | Aosta Valley | Trentino-Alto Adige | Overseas | Total seats | |||||||||||||
|---|---|---|---|---|---|---|---|---|---|---|---|---|---|---|---|---|---|---|---|---|
| Votes | % | Seats | Votes | % | Seats | Votes | % | Seats | Votes | % | Seats | Votes | % | Seats | ||||||
| Centre-right | Brothers of Italy | 7,167,136 | 26.01 | 34 | 12,129,547 | 44.02 | 30 | 18,509 | 34.05 | – | 137,015 | 27.24 | 1 | 294,712 | 27.05 | – | 65 | |||
| League | 2,439,200 | 8.85 | 13 | 15 | 1 | – | – | 30 | ||||||||||||
| Forza Italia | 2,279,802 | 8.27 | 9 | 9 | – | – | – | 18 | ||||||||||||
| Us Moderates | 243,409 | 0.88 | – | 2 | – | – | — | — | — | 2 | ||||||||||
| Centre-left | Democratic Party–IDP | 5,226,732 | 18.96 | 31 | 7,161,688 | 25.99 | 4 | [lower-alpha 1] | – | – | 149,682 | 29,29 | 1 | 370,262 | 33.98 | 3 | 39 | |||
| Greens and Left Alliance | 972,316 | 3.53 | 3 | 1 | — | — | — | – | — | — | — | 4 | ||||||||
| Campobase | — | — | — | — | — | — | — | 1 | — | — | — | 1 | ||||||||
| Others | 972,214 | 3.53 | – | – | — | — | — | – | 14,610 | 1.34 | 0 | 0 | ||||||||
| Five Star Movement | 4,285,894 | 15.55 | 23 | 4,285,894 | 15.55 | 5 | — | — | — | 28,355 | 5.64 | – | 101,794 | 9.34 | – | 28 | ||||
| Action – Italia Viva | 2,131,310 | 7.73 | 9 | 2,131,310 | 7.73 | – | — | — | — | 6,782 | 1.35 | – | 76,070 | 6.98 | – | 9 | ||||
| South Tyrolean People's Party – PATT | — | — | — | — | — | — | — | — | — | 116,003 | 23.06 | 2 | — | — | — | 2 | ||||
| South calls North | 271,549 | 0.99 | – | 271,549 | 0.99 | 1 | — | — | — | — | — | — | — | — | — | 1 | ||||
| Associative Movement of Italians Abroad | — | — | — | — | — | — | — | — | — | — | — | — | 138,758 | 12.73 | 1 | 1 | ||||
| Others | 2,119,823 | 5,72 | 0 | 2,119,823 | 5,72 | 0 | 35,850 | 65.95 | – | 65.117 | 13.42 | 0 | 93,107 | 8.54 | – | 0 | ||||
| Total | 27,569,675 | 100 | 122 | 27,569,675 | 100 | 67 | 54,359 | 100 | 1 | 502,954 | 100 | 6 | 1,090,147 | 100 | 4 | 200 | ||||
- Notes
- Within Aosta Valley
Proportional and FPTP results
| Party | Votes | % | Seats | |||
|---|---|---|---|---|---|---|
| Brothers of Italy (FdI) | 7,168,875 | 26.00 | 34 | |||
| Democratic Party – IDP (PD–IDP) | 5,220,256 | 18.93 | 31 | |||
| Five Star Movement (M5S) | 4,290,194 | 15.55 | 23 | |||
| League (Lega) | 2,437,406 | 8.84 | 13 | |||
| Forza Italia (FI) | 2,281,258 | 8.27 | 9 | |||
| Action – Italia Viva (A–IV) | 2,131,023 | 7.73 | 9 | |||
| Greens and Left Alliance (AVS) | 972,780 | 3.53 | 3 | |||
| More Europe (+E) | 810,441 | 2.94 | – | |||
| Italexit for Italy (Italexit) | 515,657 | 1.87 | – | |||
| People's Union (UP) | 374,247 | 1.36 | – | |||
| Sovereign and Popular Italy (ISP) | 309,391 | 1.12 | – | |||
| South calls North (ScN) | 272,462 | 0.99 | – | |||
| Us Moderates (NM) | 248,308 | 0.90 | – | |||
| Vita (V) | 196,644 | 0.71 | – | |||
| Civic Commitment (IC) | 161,773 | 0.59 | – | |||
| Italian Communist Party (PCI) | 70,938 | 0.26 | – | |||
| Us of the Centre – Europeanists (NDC–Eu) | 42,905 | 0.16 | – | |||
| Alternative for Italy (APLI) | 40,397 | 0.15 | – | |||
| Animalist Party – UCDL – 10VM (PAI–UCDL–10VM) | 16,950 | 0.06 | – | |||
| Workers' Communist Party (PCL) | 4,491 | 0.02 | – | |||
| United Right – Royal Italy (DU–IR) | 2,415 | 0.01 | – | |||
| Force of the People (FdP) | 864 | 0.01 | – | |||
| Total | 27,569,675 | 100.00 | 122 | |||
| Invalid / blank / unassigned votes | 1,281,165 | 4.44 | – | |||
| Total turnout | 28,850,840 | 63.81 | – | |||
| Registered voters | 45,210,950 | – | – | |||
| Source: Ministry of the Interior | ||||||
| Party or coalition | Votes | % | Seats | |||
|---|---|---|---|---|---|---|
| Centre-right coalition (CDX) | 12,135,847 | 44.02 | 56 | |||
| Centre-left coalition (CSX) | 7,165,250 | 25.99 | 5 | |||
| Five Star Movement (M5S) | 4,290,194 | 15.55 | 5 | |||
| Action – Italia Viva (A–IV) | 2,131,023 | 7.73 | – | |||
| Italexit for Italy (Italexit) | 515,657 | 1.87 | – | |||
| People's Union (UP) | 374,247 | 1.36 | – | |||
| Sovereign and Popular Italy (ISP) | 309,391 | 1.12 | – | |||
| South calls North (ScN) | 272,462 | 0.99 | 1 | |||
| Vita (V) | 196,644 | 0.71 | – | |||
| Italian Communist Party (PCI) | 70,938 | 0.26 | – | |||
| Us of the Centre – Europeanists (NDC–Eu) | 42,905 | 0.16 | – | |||
| Alternative for Italy (APLI) | 40,397 | 0.15 | – | |||
| Animalist Party – UCDL – 10VM (PAI–UCDL–10VM) | 16,950 | 0.06 | – | |||
| Workers' Communist Party (PCL) | 4,491 | 0.02 | – | |||
| United Right – Royal Italy (DU–IR) | 2,415 | 0.01 | – | |||
| Force of the People (FdP) | 864 | 0.01 | – | |||
| Total | 27,569,675 | 100.00 | 67 | |||
| Invalid / blank / unassigned votes | 1,281,165 | 4.44 | – | |||
| Total turnout | 28,850,840 | 63.81 | – | |||
| Registered voters | 45,210,950 | – | – | |||
| Source: Ministry of the Interior | ||||||
Aosta Valley
| Candidate | Party | Votes | % | Result | |
|---|---|---|---|---|---|
| Nicoletta Spelgatti | Centre-right coalition (Lega–FI–NM–FdI) | 18,509 | 34.05 | ||
| Patrik Vesan | Aosta Valley (VdA)[lower-alpha 1] | 18,282 | 33.63 | ||
| Augusto Rollandin | For Autonomy (PlA) | 7,272 | 13.38 | ||
| Daria Pulz | Open Aosta Valley (Open VdA)[lower-alpha 2] | 5,448 | 10.02 | ||
| Alessandro Bianchini | Sovereign and Popular Italy (ISP) | 1,569 | 2.89 | ||
| Francesco Lucat | People's Union (UP) | 1,311 | 2.41 | ||
| Guglielmo Leray | Italian Communist Party (PCI) | 1,051 | 1.93 | ||
| Larisa Bargan | Vita (V) | 917 | 1.69 | ||
| Total | 54,359 | 100.00 | 1 | ||
| Invalid / blank / unassigned votes | 5,131 | 8.62 | – | ||
| Total turnout | 59,490 | 60.59 | – | ||
| Registered voters | 98,187 | – | – | ||
| Source: | |||||
Trentino-Alto Adige
| Party | Votes | % | Seats | ||
|---|---|---|---|---|---|
| Centre-right coalition (Lega–FI–NM–FdI) | 137,015 | 27.24 | 2 | ||
| South Tyrolean People's Party – PATT (SVP–PATT) | 116,003 | 23.06 | 2 | ||
| Centre-left coalition (CB–+E–AVS–PD–A–IV) | 100,602 | 20.00 | 1 | ||
| Five Star Movement (M5S) | 28,355 | 5.64 | – | ||
| Centre-left coalition (PD–IDP–+E–AVS) | 21,894 | 4.35 | 1 | ||
| Vita (V) | 17,876 | 3.55 | – | ||
| Greens and Left Alliance (AVS) | 17,574 | 3.49 | – | ||
| Sovereign and Popular Italy (ISP) | 15,252 | 3.03 | – | ||
| Die Freiheitlichen (DF) | 14,479 | 2.88 | – | ||
| Team K (TK) | 11,157 | 2.22 | – | ||
| Democratic Party – IDP (PD–IDP) | 9,612 | 1.91 | – | ||
| Action – Italia Viva (A–IV) | 6,782 | 1.35 | – | ||
| People's Union (UP) | 6,353 | 1.26 | – | ||
| Total | 502,954 | 100.00 | 6 | ||
| Invalid / blank / unassigned votes | 32,625 | 6.09 | – | ||
| Total turnout | 811,006 | 66.04 | – | ||
| Registered voters | – | – | |||
| Source: | |||||
- Including Democratic Party (PD), Action (A), Italia Viva (IV), Valdostan Union (UV), Valdostan Alliance (AV), United Aosta Valley (VdAU), and Edelweiss (SA)
- Including Five Star Movement (M5S), Democratic Area (AD–GA), Environment Rights Equality (ADU), and Italian Left (SI)
Overseas constituencies
Four members of the Senate of the Republic are elected by Italians abroad. One member is elected for North America and Central America (including most of the Caribbean), one member for South America (including Trinidad and Tobago), one member for Europe, and one for the rest of the world (Africa, Asia, Oceania, and Antarctica). Voters in these regions select candidate lists and cast a preference vote for individual candidates. The seats are allocated by proportional representation. The electoral law allows for parties to form different coalitions on the lists abroad, compared to the lists in Italy; since January 2018, Forza Italia, the League, and Brothers of Italy have formed a unified list for abroad constituencies.[7]
| Party | Votes | % | Seats | |||
|---|---|---|---|---|---|---|
| Democratic Party – IDP (PD–IDP) | 370,549 | 33.99 | 3 | |||
| League – Forza Italia – Brothers of Italy (Lega–FI–FdI) | 295,467 | 27.10 | – | |||
| Associative Movement of Italians Abroad (MAIE) | 138,337 | 12.69 | 1 | |||
| Five Star Movement (M5S) | 101,925 | 9.35 | – | |||
| Action – Italia Viva (A–IV) | 76,152 | 6.99 | – | |||
| South American Union of Italian Emigrants (USEI) | 55,523 | 5.09 | – | |||
| Movement of Freedoms (MdL) | 23,384 | 2.15 | – | |||
| Civic Commitment (IC) | 14,610 | 1.34 | – | |||
| Italy of the South (IdM) | 14,200 | 1.30 | – | |||
| Total | 1,090,147 | 100.00 | 4 | |||
| Invalid / blank / unassigned votes | 143,681 | 11.65 | – | |||
| Total turnout | 1.233.828 | 26.01 | – | |||
| Registered voters | 4,743,980 | – | – | |||
| Source: Ministry of the Interior | ||||||
Voter turnout
| Year | Voter turnout | Voters | Registered voters | Population | Invalid votes |
|---|---|---|---|---|---|
| 1946 | 89.08% | 24,947,187 | 28,005,449 | 44,994,000 | 7.70% |
| 1948 | 92.23% | 26,854,203 | 29,117,554 | 45,706,000 | 2.20% |
| 1953 | 93.87% | 28,410,851 | 30,267,080 | 47,756,000 | 4.30% |
| 1958 | 93.72% | 30,399,708 | 32,436,022 | 49,041,000 | 2.80% |
| 1963 | 92.88% | 31,766,058 | 34,201,660 | 50,498,000 | 3.20% |
| 1968 | 92.79% | 33,003,249 | 35,566,681 | 52,910,000 | 3.60% |
| 1972 | 93.18% | 34,524,106 | 37,049,654 | 54,410,000 | 3.20% |
| 1976 | 93.37% | 37,741,404 | 40,423,131 | 55,701,000 | 2.70% |
| 1979 | 90.35% | 38,112,228 | 42,181,664 | 56,292,000 | 3.90% |
| 1983 | 89.02% | 39,114,321 | 43,936,534 | 56,836,000 | 5.70% |
| 1987 | 88.86% | 40,599,490 | 45,689,829 | 57,345,000 | 4.90% |
| 1992 | 87.44% | 41,479,764 | 47,435,964 | 56,859,000 | 5.40% |
| 1994 | 86.14% | 41,461,260 | 48,135,041 | 57,049,000 | 5.90% |
| 1996 | 82.91% | 40,496,438 | 48,846,238 | 57,239,000 | 7.80% |
| 2001 | 81.44% | 40,195,500 | 49,358,947 | 57,684,294 | 7.20% |
| 2006 | 83.62% | 39,298,497 | 46,997,601 | 58,103,033 | 2.90% |
| 2008 | 80.54% | 37,954,253 | 47,126,326 | 58,147,733 | 5.10% |
| 2013 | 75.19% | 35,271,541 | 46,905,154 | 61,482,297 | 3.59% |
| 2018 | 72.93% | 33,923,321 | 46,505,499 | 60,589,445 | 4.33% |
Graph of general election results
This graph shows the results of elections held in Italy from 1946 to 2018, with the percentages of consensus gathered by the various parties and movements displayed by color. Passing your mouse over the different colored sections will display the name of the grouping and the percentage in the corresponding election. Clicking on a region will direct you to the article on the party or election selected.
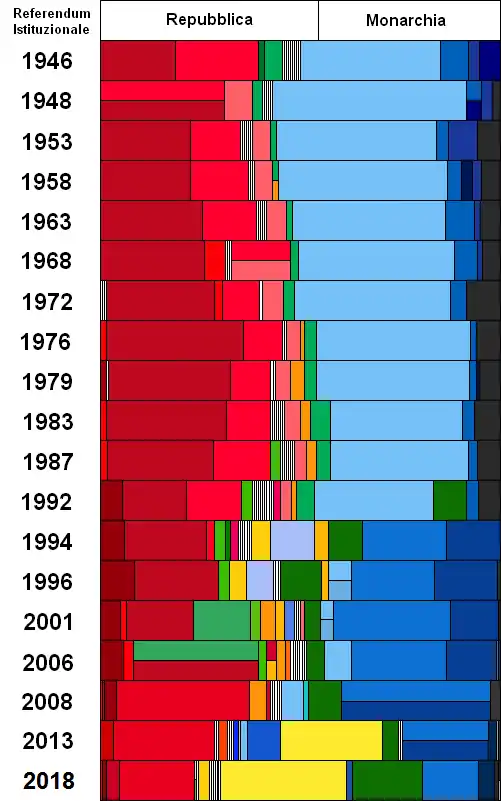
This is, instead, the graph for general elections from 1946 in Italy by absolute numbers of votes for every party:
_-_Italian_general_elections_graph_(1946-2022).svg.png.webp)
Regional elections
Referendums
The constitution of Italy provides for two kinds of binding referendums.
A legislative referendum can be called in order to abrogate a law totally or partially, if requested by 500,000 electors or five regional councils. This kind of referendum is valid only if at least a majority of electors goes to the polling station. It is forbidden to call a referendum regarding financial laws or laws relating to pardons or the ratification of international treaties.
A constitutional referendum can be called in order to approve a constitutional law or amendment only when it has been approved by the Houses (Chamber of Deputies and Senate of the Republic) with a majority of less than two thirds in both or either House, and only at the request of one fifth of the members of either House, or 500,000 electors or five Regional Councils. A constitutional referendum is valid no matter how many electors go to the polling station. Any citizen entitled to vote in an election may participate in a referendum.
See also
References
- Viganò, Edoardo Alberto (2023). "Electoral Incentives and Geographical Representation: Evidence from an Italian Electoral Reform". Legislative Studies Quarterly. doi:10.1111/lsq.12418. ISSN 0362-9805.
- "Eligendo: Camera [Scrutini] (esclusa Valle d'Aosta)". Eligendo (in Italian). Italian Ministry of the Interior. 25 September 2022. Retrieved 27 September 2022.
- "Elezioni: Valle d'Aosta, ammesse tutte le nove liste candidate" (in Italian). ANSA. 23 August 2022. Retrieved 24 August 2022.
- "Collegio uninominale Valle d'Aosta – U01 (Aosta) (Precedente: 04/03/2018)" (in Italian). Italian Minister of the Interior. 25 September 2022. Retrieved 26 September 2022.
- "Elezioni, 'Salvini, Berlusconi, Meloni' e il tricolore, il simbolo del centro-destra per l'estero". Affaritaliani (in Italian). 21 January 2018. Retrieved 17 February 2022.
- "Eligendo: Senato [Scrutini] Italia (escluse Valle d'Aosta e Trentino-Alto Adige/Südtirol)". Eligendo (in Italian). Italian Ministry of the Interior. 25 September 2022. Retrieved 27 September 2022.
- "Elezioni, 'Salvini, Berlusconi, Meloni' e il tricolore, il simbolo del centro-destra per l'estero". Affaritaliani (in Italian). 21 January 2018. Retrieved 17 February 2022.
External links
- Adam Carr's Election Archive
- Parties and elections
- Ministry of Internal Affairs of Italy - Page on Elections
- NSD: European Election Database - Italy publishes regional level election data
- Italy Election Data, European Journal of Political Research-Political Data Yearbook: Interactive
| General | |
|---|---|
| European | |
| Regional | |
| Local |
|
| Referendums | |
| By-elections | |
| Provisional Head of State | |
|---|---|
| President of the Republic | |
| History |
| ||||||||||||||||
|---|---|---|---|---|---|---|---|---|---|---|---|---|---|---|---|---|---|
| Geography | |||||||||||||||||
| Politics | |||||||||||||||||
| Economy | |||||||||||||||||
| Society |
| ||||||||||||||||