Electricity sector in Germany
Germany's electrical grid is part of the Synchronous grid of Continental Europe. In 2020, due to COVID-19 conditions and strong winds, Germany produced 484 TW⋅h of electricity of which over 50% was from renewable energy sources, 24% from coal, and 12% from natural gas.[4] This is the first year renewables represented more than 50% of the total electricity production and a major change from 2018, when a full 38% was from coal, only 40% was from renewable energy sources, and 8% was from natural gas.[5]
| Data | |
|---|---|
| Continuity of supply | 0.2815 h (16.89 min) interruption per subscriber per year |
| Installed capacity (2020) | 211.31 GW[1] |
| Production (2021) | 490.6 TW⋅h[2] |
| Share of fossil energy | 40.9% (2021)[2] |
| Share of renewable energy | 45.8% (2021)[2] |
| GHG emissions from electricity generation (2013) | 363.7 Mt CO2 [631.4 TW⋅h × 576 g/kW⋅h] |
| Tariffs and financing | |
| Average industrial tariff (US$/kW·h, 2013) | medium: 20.60[3] |

Germany's installed capacity for electric generation increased from 121 gigawatts (GW) in 2000 to 218 GW in 2019, an 80% increase, while electricity generation increased only 5% in the same period.[6]
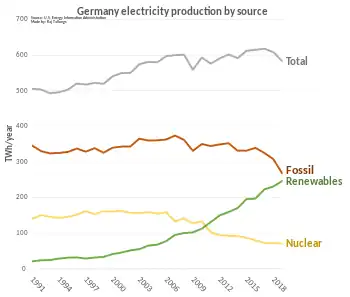
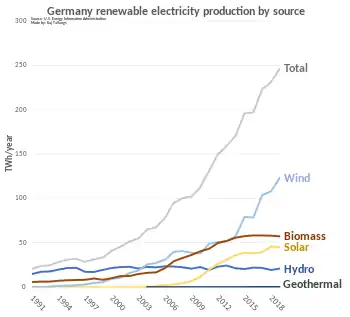
Even though renewables production increased significantly between 1991 and 2017, fossil power production remained at more or less constant levels. In the same period, nuclear power production decreased due to the phase-out plan, and much of the increase in renewables filled the gap left behind by closing nuclear power plants. However 2019 and 2020 saw significant reductions in electricity generation from fossil fuel, from 252 TW⋅h in 2018 to 181 TW⋅h in 2020. The German government decided to phase-out nuclear power by end of 2022, however this has been delayed until April 2023 due to supply disruption caused by the war in Ukraine,[7] meaning that future growth in renewables will be needed to fill the gap again. Germany also plans to phase out coal by 2038 or earlier.[8]
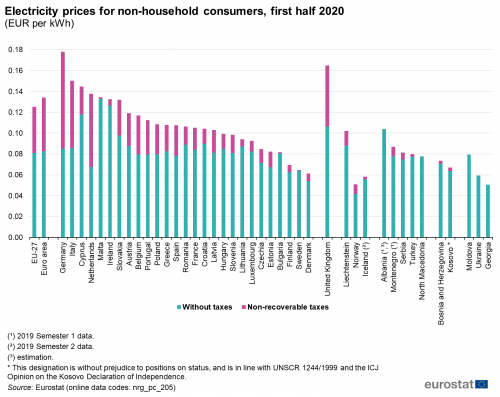
Electricity prices
German electricity prices in 2020 were 31.47 euro cents per kW⋅h for residential customers (an increase of 126% since 2000),[9] and 17.8 euro cents per kW⋅h for non-residential customers (21.8 with taxes).[10][11][12]
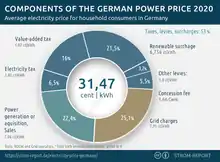
German households and small businesses pay the highest electricity price in Europe for many years in a row now. More than half of the power price consists of components determined by the state (53%). These Taxes, levies and surcharges have tripled since 2000 [from 5.19 to 16.49 Euro Cents]. These include levies for financing investment in renewable energy (22.1%) and for other kinds of taxes (e.g. GST 19%). Grid charges account for almost 25%, and only the remaining 22% are used to actually generate the electricity.
International electricity trade
Germany exported 70,237 GWh of electricity and imported 51,336 GWh in 2021.[13] Germany is the second largest exporter of electricity after France, representing about 10% of electricity exports worldwide. [14][15] Germany has grid interconnections with neighboring countries representing 10% of domestic capacity.[16]: 5
Electricity per person and by power source
Germany produced power per person in 2008 equal to the EU-15 average (EU-15: 7,409 kWh/person) and 77% of the OECD average (8,991 kW⋅h/person).[17]
On 8 May 2016 renewables supplied 87.6% of Germany's national electricity consumption, albeit under extremely favourable weather conditions.[18]: 11
| Use | Production | Export | Exp. % | Fossil | Fossil % | Nuclear | Nuc. % | Other RE* | Bio+waste | Wind | Non RE use* | RE % | |
|---|---|---|---|---|---|---|---|---|---|---|---|---|---|
| 2004 | 7,445 | 7,476 | 32 | 0.4% | 4,603 | 61.5% | 2,025 | 27.2% | 654 | 194 | 6,597 | 11.4% | |
| 2005 | 7,468 | 7,523 | 55 | 0.7% | 4,674 | 62.1% | 1,977 | 26.5% | 670 | 201 | 6,597 | 11.7% | |
| 2006 | 7,528 | 7,727 | 199 | 2.6% | 4,796 | 62% | 1,706 | 22.7% | 856 | 369 | 6,303 | 16.3% | |
| 2008 | 7,450 | 7,693 | 243 | 3.3% | 4,635 | 60% | 1,804 | 24.2% | 873 | 381 | 6,196 | 16.8% | |
| 2009 | 7,051 | 7,200 | 149 | 2.1% | 4,314 | 59.9% | 1,644 | 23.3% | 288* | 491 | 461* | 5,811 | 17.6% |
| 2017 | 6,038 | 6,678 | 640 | 9.5% | 3,199 | 48.6% | 873 | 13.2% | 711 | 574 | 1,252 | 3,501 | 38.2% |
| * This data for Germany is extracted from the international column of a Swedish report * Other RE is waterpower, solar and geothermal electricity and wind power until 2008 * Non RE use = use – production of renewable electricity * RE % = (production of RE / use) * 100% Note: European Union calculates the share of renewable energies in gross electrical consumption. | |||||||||||||
Mode of production

- Wind: 123.44 TW⋅h (25.2%)
- Brown coal: 106.64 TW⋅h (21.8%)
- Solar: 57.61 TW⋅h (11.8%)
- Hard coal: 55.58 TW⋅h (11.4%)
- Natural gas: 46.43 TW⋅h (9.5%)
- Biomass: 42.18 TW⋅h (8.6%)
- Nuclear: 32.79 TW⋅h (6.7%)
- Hydro: 15.05 TW⋅h (3.1%)
- Oil: 0.68 TW⋅h (0.1%)
- Other: 8.66 TW⋅h (1.8%)
.png.webp)
According to the IEA the gross production of electricity was 631 TW⋅h in 2008 which gave the seventh position among the world top producers in 2010. The top seven countries produced 59% of electricity in 2008. The top producers were the United States (21.5%), China (17.1%), Japan (5.3%), Russia (5.1%), India (4.1%), Canada (3.2%) and Germany (3.1%).[22]
In 2020, Germany generated electricity from the following sources: 27% wind, 24% coal, 12% nuclear, 12% natural gas, 10% solar, 9.3% biomass, 3.7% hydroelectricity.[4]
Coal
In 2008, power from coal supplied 291 TW⋅h or 46% of Germany's overall production of 631 TW⋅h, but this dropped to 118 TW⋅h (24%) in 2020.[4] In 2010 Germany was still one of the world's largest consumers of coal at 4th place behind China (2,733 TW⋅h), USA (2,133 TW⋅h) and India (569 TW⋅h).[22] By 2019 it had fallen to 8th, behind smaller countries such as South Korea and South Africa.[23]
Germany has shut all hardcoal mines by the end of 2018, but still has large open pit mines for lignite in the Western and Eastern parts of the country.
In January 2019 the German Commission on Growth, Structural Change and Employment initiates Germany's plans to entirely phase out and shut down the 84 remaining coal-fired plants on its territory by 2038.[8]
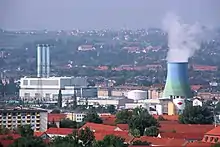 Gas power station Nossener Brücke in Dresden
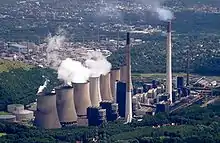
Nuclear power
Germany has defined a firm active phase-out policy of nuclear power. Eight nuclear power plants were permanently shut down after the Fukushima accident. All nuclear power plants are to be phased out by the end of 2022. According to BMU this is an opportunity for future generations.[24]
Siemens is the only significant nuclear constructor in Germany and the nuclear share was 3% of their business in 2000.[25] In 2006 large international bribes by Siemens in the energy and telecommunication business were revealed. The case was investigated, for example, in Nigeria, the United States, Greece and South Korea.[26]
The installed nuclear power capacity in Germany was 20 GW in 2008 and 21 GW in 2004. The production of nuclear power was 148 TW⋅h in 2008 (sixth top by 5.4% of world total) and 167 TW⋅h in 2004 (fourth top by 6.1% of world total).[22][27]
In 2009, nuclear power production saw a 19% reduction compared to 2004, and its share had declined smoothly over time from 27% to 23%. The share of renewable electricity increased, substituting for nuclear power.[17]
Renewable electricity
.png.webp)
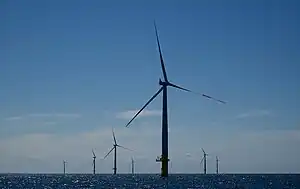
Germany has been called "the world's first major renewable energy economy".[28][29] Renewable energy in Germany is mainly based on wind, solar and biomass. Germany had the world's largest photovoltaic installed capacity until 2014, and as of 2016, it is third with 40 GW. It is also the world's third country by installed wind power capacity, at 50 GW, and second for offshore wind, with over 4 GW.
Chancellor Angela Merkel, along with a vast majority of her compatriots, believes, "As the first big industrialized nation, we can achieve such a transformation toward efficient and renewable energies, with all the opportunities that brings for exports, developing new technologies and jobs".[30] The share of renewable electricity rose from just 3.4% of gross electricity consumption in 1990 to exceed 10% by 2005, 20% by 2011 and 30% by 2015, reaching 36.2% of consumption by year end 2017.[31] As with most countries, the transition to renewable energy in the transport and heating and cooling sectors has been considerably slower.
More than 23,000 wind turbines and 1.4 million solar PV systems are distributed all over the country.[32][33] According to official figures, around 370,000 people were employed in the renewable energy sector in 2010, particularly in small and medium-sized companies.[34] This is an increase of around 8% compared to 2009 (around 339,500 jobs), and well over twice the number of jobs in 2004 (160,500). About two-thirds of these jobs are attributed to the Renewable Energy Sources Act.[35][36]
Germany's federal government is working to increase renewable energy commercialization,[37] with a particular focus on offshore wind farms.[38] A major challenge is the development of sufficient network capacities for transmitting the power generated in the North Sea to the large industrial consumers in southern parts of the country.[39] Germany's energy transition, the Energiewende, designates a significant change in energy policy from 2011. The term encompasses a reorientation of policy from demand to supply and a shift from centralized to distributed generation (for example, producing heat and power in very small cogeneration units), which should replace overproduction and avoidable energy consumption with energy-saving measures and increased efficiency. At the end of 2020, Germany had 2.3 GW⋅h of home battery storage, often in conjunction with solar panels.[40]
Transmission network
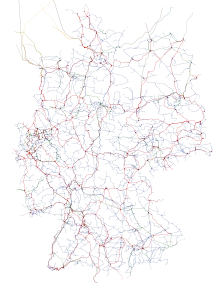
Grid owners included, in 2008, RWE, EnBW, Vattenfall and E.ON. According to the European Commission the electricity producers should not own the electricity grid to ensure open competition. The European Commission accused E.ON of the misuse of markets in February 2008. Consequently, E.ON sold its share of the network.[41] As of July 2016 the four German TSOs are:
- 50Hertz Transmission GmbH (owned by Elia, formerly owned by Vattenfall)
- Amprion GmbH (RWE)
- Tennet TSO GmbH (owned by TenneT, formerly owned by E.ON)
- TransnetBW (renamed from EnBW Transportnetze AG and a 100% subsidiary of EnBW)
In Germany, there also exists a single-phase AC grid operated at 16.7 Hz to supply power to rail transport, see list of installations for 15 kV AC railway electrification in Germany, Austria and Switzerland.
Special features of German transmission network
There are some special features in the transmission network of Germany. Also they have no direct influence on operation, they are remarkable under technical viewpoints.
Garland-type communication cables
Many powerlines in Baden-Württemberg, which were built by Energie-Versorgung-Schwaben (EVS, now part of EnBW) are equipped with a communication cable, which hangs like a garland on the ground conductor. Some of these lines have also a second communication cable hanging on an auxiliary wire, which is usually fixed on the pinnacle of the pylon below the ground conductor. Such devices are usually installed on lines with voltages of 110 kV and more, but there existed also a 20 kV-line near Eberdingen, which had a communication cable fixed like a garland on a conductor rope. Although communication cables fixed like a garland where replaced in the last decades by free-hanging communication cables many of these devices are still in use. If a downlink of the communication cable from the suspension level to the ground is necessary, which is for example the case at amplifier stations, lines built by former Energie-Versorgung-Schwaben (EVS) use therefore a cable in the centre of the tower strung by a pond instead of a cable fixed at the tower structure. This construction type can be found as well on lines using garland-type communication cables as on lines using freely span communication cables.
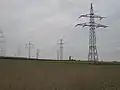 A 110 kV-line with a communication cable hanging like a garland on the ground conductor
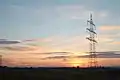 380 kV/110 kV-line Pulverdingen-Oberjettingen with two communication cables hanging like garlands on ropes above the power conductors
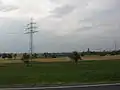 A 110 kV-line with two communication cables fixed like garlands on grounded ropes on a half of the lowest crossbar
 20 kV-line near Eberdingen with communication cable hanging like a garland on the lowest conductor
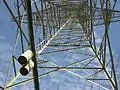 Communication cable running down in the centre of the pylon
Powerline crossings of Elbe river near Stade
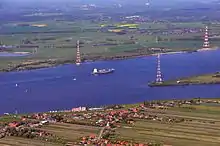
Two powerline crossings of Elbe river near Stade, whose pylons belong to the tallest in Europe.
Elbe Crossing 1 is a group of masts providing an overhead crossing of a 220 kV three-phase alternating current electric powerline across the River Elbe.[42] Constructed between 1959 and 1962 as part of the line from Stade to Hamburg north, it consists of four masts. Each of the two portal masts is a guyed mast 50 metres (160 ft) in height with a crossbeam at a height of 33 metres (108 ft). One of these masts stands on the Schleswig-Holstein bank of the Elbe and the other on the Lower Saxony bank. Two identical carrying masts 189 metres (620 ft) in height, each weighing 330 tonnes (320 long tons; 360 short tons), ensure the necessary passage height of 75 metres (246 ft) over the Elbe. One stands on the island of Lühesand, the other in the Buhnenfeld on the Schleswig-Holstein side.
Because of the swampy terrain, each mast's foundation is built on pilings driven into the ground. The Lühesand portal mast rests on 41 pilings and the one on the Buhnenfeld on 57. In contrast to the usual construction of such lattice-steel transmission towers, the direction of the line passes diagonally over the square ground cross section of the pylon, resulting in savings in material. The two crossbeams for the admission of the six conductor cables are at a height of 166 metres (545 ft) and 179 metres (587 ft). The mast on the Buhnenfeld bears at a height of 30 metres (98 ft) a radar facility belonging to the Water and Navigation Office of the Port of Hamburg. Each portal mast has stairs and gangways for maintenance of flight safety beacons, and has a hoist for heavy loads.
Elbe Crossing 2 is a group of transmission towers providing overhead lines for four 380 kV three-phase alternating current (AC) circuits across the German river Elbe.[43][44] It was constructed between 1976 and 1978 to supplement Elbe Crossing 1, and consists of four towers:
- A 76-metre-tall anchor pylon located in Lower Saxony, on the Elbe's southern banks.
- Two carrying pylons, each 227 metres (745 ft) tall. One is located on the island of Lühesand and the other is near Hetlingen in Schleswig-Holstein, on the northern shore.
- These pylons are the tallest pylons in Europe and the sixth tallest of the world. They stand on 95 piers because of the unfavorable building ground. The base of each pylon measures 45 by 45 metres (148 ft × 148 ft) and each pylon weighs 980 tonnes (960 long tons; 1,080 short tons). Crossbeams, which hold up the power cables, are located at heights of 172 (564), 190 (620) and 208 metres (682 ft). The crossbeams span 56 metres or 184 feet (lowest crossbeam), 72 metres or 236 feet (middle crossbeam) and 57 metres or 187 feet (highest crossbeam). Each pylon has a self-propelled climbing elevator for maintenance of the aircraft warning lights; each elevator runs inside a steel tube in the centre of the mast, around which there is a spiral staircase.
- A 62-metre-tall (203 ft) anchor pylon on the Schleswig-Holstein side.
The enormous height of the two carrying pylons ensures that the passage height requirement of 75 metres (246 ft) over the Elbe demanded by German authorities is met. The height requirement ensures that large ships are able to enter Hamburg's deep-water port.
Other features
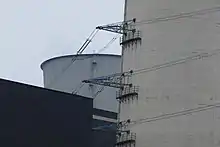
A 302 metres tall cooling tower of Scholven Power Station at Gelsenkirchen, which is used by four units of these thermal power station is equipped with three booms carrying the conductors of a 220 kV-circuit leaving one of these units.
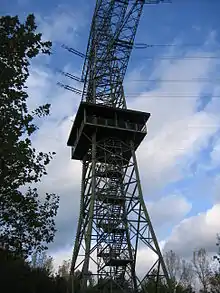
From 1977 to 2010 a 74.84 metres high strainer of powerline Oberzier-Niedersechtem was equipped with a public observation deck in a height of 27 metres, which was accessible by a staircase. After too much vandalism occurred, which endangered also the integrity of the pylon, this observation deck was removed.
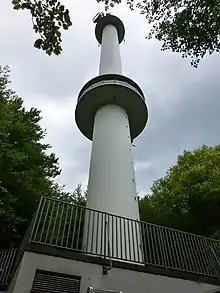
As in many other countries, power companies in Germany use radio relay links for data transmissions. In most cases the antennas used therefore are installed on lattice towers, but at some sites concrete towers are used for this purpose. The 87 metres tall radio relay tower on Goose Neck mountain (German: Gänsehals) near Bell is the only of these towers equipped with a public observation deck. It is situated in a height of 24 metres and accessible by a staircase.
Summary table
| Source | Generation (GWh) | Capacity (MW) | |||
|---|---|---|---|---|---|
| Total | 557,144 | 100.0% | 250,385 | 100.0% | |
| Fossil fuels | 260,790 | 46.8% | 98,311 | 39.3% | |
| Renewables | 233,000 | 41.8% | 137,762 | 55.0% | |
| Wind | 113,624 | 20.4% | 63,865 | 25.5% | |
| Solar | 49,992 | 9.0% | 58,728 | 23.5% | |
| Biomass and waste | 49,883 | 9.0% | 10,439 | 4.2% | |
| Hydroelectricity | 19,252 | 3.5% | 6,199 | 2.5% | |
| Geothermal | 249 | 0.04% | 46 | 0.02% | |
| Nuclear | 65,441 | 11.7% | 8,113 | 3.2% | |
| Hydroelectric pumped storage | -2,087 | -0.4% | 6,199 | 2.5% | |
| Consumption* | 511,660 | 91.8% | |||
| Exports | 70,237 | 12.6% | |||
| Imports | 51,336 | 9.2% | |||
| Distribution losses | 26,582 | 4.8% | |||
*Consumption = Generation - Exports + Imports - Distribution losses
References
- "Energy-Charts". www.energy-charts.info.
- Burger, Bruno (14 February 2022). Öffentliche Nettostromerzeugung in Deutschland im Jahr 2021 [Public Net Electricity Generation in Germany in 2021] (PDF) (in German). Freiburg, Germany: Fraunhofer-Institut für Solare Energiesysteme ISE. Retrieved 17 May 2022.
- "Energie-Info EE und das EEG2013" (PDF). BDEW. 2013. Archived from the original (PDF) on 15 August 2013. Retrieved 21 June 2016.
- Burger, Bruno (4 January 2021). Public Net Electricity Generation in Germany 2020 (PDF). Retrieved 3 June 2021.
{{cite book}}:|website=ignored (help) - "Electricity generation | Energy Charts". www.energy-charts.de. Fraunhofer ISE. Retrieved 3 June 2020.
- "Germany's Energiewende, 20 Years Later".
In 2000, Germany had an installed capacity of 121 gigawatts and it generated 577 terawatt-hours, which is 54 percent as much as it theoretically could have done (that is, 54 percent was its capacity factor). In 2019, the country produced just 5 percent more (607 TW⋅h), but its installed capacity was 80 percent higher (218.1 GW) because it now had two generating systems.
- "Germany: Nuclear phase-out postponed for three and a half months".
- Kirschbaum, Erik (26 January 2019). "Germany to close all 84 of its coal-fired power plants, will rely primarily on renewable energy". Los Angeles Times. Archived from the original on 30 January 2019. Retrieved 27 January 2019.
Germany, one of the world's biggest consumers of coal, will shut down all 84 of its coal-fired power plants over the next 19 years to meet its international commitments in the fight against climate change, a government commission said Saturday.
- "Electricity Price Germany: What households pay for power". Strom-Report. Retrieved 3 March 2021.
- "Electricity price statistics, first half 2020 – Statistics Explained". ec.europa.eu.
- "EU price diagram, first half 2020".
- "Excluding VAT and other recoverable taxes and levies, first half 2020". ec.europa.eu.
- "Electricity". U.S. Energy Information Administration.
- ., Countries by Electricity Exports, AtlasBig
- .Germany Power Market, Enerdata Yearbook Publication 2011
- http://eur-lex.europa.eu/resource.html?uri=cellar:a5bfdc21-bdd7-11e4-bbe1-01aa75ed71a1.0003.01/DOC_1&format=PDF
- German numbers extracted from Energy in Sweden, Facts and figures, The Swedish Energy Agency, (in Swedish: Energiläget i siffror), Table: Specific electricity production per inhabitant with breakdown by power source (kW⋅h/person), Source: IEA/OECD 2006 T23 Archived 4 July 2011 at the Wayback Machine, 2007 T25 Archived 4 July 2011 at the Wayback Machine, 2008 T26 Archived 4 July 2011 at the Wayback Machine, 2009 T25 Archived 20 January 2011 at the Wayback Machine and 2010 T49 Archived 16 October 2013 at the Wayback Machine.
- WWF (September 2016). 15 signals: evidence the energy transition is underway (PDF). Paris, France: WWF France. Retrieved 17 September 2016.
- Energy in Sweden – facts and figures 2012 – Figures for 2009 Table 53: Electricity production by power source, 2009, in kW⋅h/capita, page 59, 2012
- "Power generation in Germany – assessment of 2017" (PDF). www.ise.fraunhofer.de. Fraunhofer Institute for Solar Energy Systems ISE. Retrieved 29 December 2018.
- Burger, Bruno (21 January 2023). Öffentliche Nettostromerzeugung in Deutschland im Jahr 2022 [Public Net Electricity Generation in Germany in 2022] (PDF) (in German). Freiburg, Germany: Fraunhofer-Institut für Solare Energiesysteme ISE. Retrieved 28 June 2023.
- IEA Key stats 2010 pages electricity 27 gas 13,25 fossil 25 nuclear 17
- "Coal consumption by country 2020". Statista.
- The path to the energy of the future — safe, affordable and environmentally sound Archived 26 September 2011 at the Wayback Machine June 2011 BMU Germany
- Climate Change and Nuclear Power WWF pages 21, 22
- [Siemensin lahjusskandaali paisuu edelleen] yle 23.11.2006
- "IEA Key energy statistics 2006" (PDF). Archived from the original (PDF) on 12 October 2009. Retrieved 22 February 2011.
- Germany: The World's First Major Renewable Energy Economy
- Fraunhofer ISE, Electricity production from solar and wind in Germany – New record in wind power production, p.2 15 December 2014
- Alexander Ochs (16 March 2012). "The End of the Atomic Dream: One Year After Fukushima, the Shortfalls of Nuclear Energy Are Clearer Than Ever". Worldwatch.
- "Zeitreihen zur Entwicklung der erneuerbaren Energien in Deutschland" [Historic data about the development of renewable energies in Germany]. Erneuerbare Energien (in German). February 2018. Retrieved 9 August 2018.
- http://www.wind-energie.de, Number of Wind Turbines in Germany Archived 29 March 2016 at the Wayback Machine, 2012
- Fraunhofer ISE Recent Facts about Photovoltaics in Germany, p.5, 16 October 2014
- Gerhardt, Christina (9 June 2016). "Germany's Renewable Energy Shift: Addressing Climate Change". Capitalism, Nature, Socialism. 28 (2): 103–119. doi:10.1080/10455752.2016.1229803. S2CID 157399085.
- "Renewable Energy Sources in Figures – National and International Development" (PDF). Archived from the original (PDF) on 2 March 2012.
- "Germany Leads Way on Renewables, Sets 45% Target by 2030". Archived from the original on 2 December 2013. Retrieved 9 December 2018.
- "100% renewable electricity supply by 2050". Federal Ministry for Environment, Nature Conservation and Nuclear Safety. 26 January 2011. Archived from the original on 9 May 2011. Retrieved 4 June 2011.
- Schultz, Stefan (23 March 2011). "Will Nuke Phase-Out Make Offshore Farms Attractive?". Spiegel Online. Retrieved 26 March 2011.
- The Wall Street Journal Online, 24 April 2012
- Vorrath, Sophie (24 March 2021). "Germany installed 100,000 home batteries in "year of Corona"". One Step Off The Grid. Archived from the original on 25 March 2021.
- Lehmänkaupat hämmentävät EU:n energianeuvotteluja, Helsingin Sanomat 1.3.2008 B11
- "Die 380/220-kV-Elbekreuzung im 220-kV-Netz der Nordwestdeutschen Kraftwerke AG" by Hans Heino Moeller of the NWK, Hamburg
- "Die Maste der neuen 380-kV-Hochspannungsfreileitung über die Elbe" NWK special edition of "Der Stahlbau", 48th year, issues 11 and 12, pp. 321 to 326, pp. 360 to 366, authors: Friedrich Kießling, Hans Dieter Sperl and Friedrich Wagemann
- "Die neue 380-kV-Elbekreuzung der Nordwestdeutsche Kraftwerke AG" NWK special edition of "Elektrizitätswirtschaft", 77th year, issue 10 (May 8, 1978) pp. 341 to 352
External links
- Evans, Simon; Pearce, Rosamund (20 September 2016). "Mapped: how Germany generates its electricity". Carbon Brief. London, United Kingdom. Retrieved 6 October 2016.
- Household electricity prices, 2006–2017 (CC image)