Energy in Iraq
The energy sector of Iraq is mostly concentrated around oil and gas.[1]
Overview
| Population (million) | Prim. energy (TWh) |
Production (TWh) |
Export (TWh) |
Electricity (TWh) |
CO2-emission (Mt) | |
|---|---|---|---|---|---|---|
| 2004 | 25.4 | 346 | 1,203 | 851 | 31.6 | 81.2 |
| 2007 | 27.5 | 385 | 1,219 | 824 | 32.3 | 91.5 |
| 2008 | 28.2 | 395 | 1,369 | 966 | 35.8 | 97.4 |
| 2009 | 29.0 | 374 | 1,391 | 1,009 | 33.2 | 98.8 |
| 2010 | 32.32 | 440 | 1,466 | 1,017 | 37.9 | 104.5 |
| 2012 | 32.96 | 468 | 1,652 | 1,172 | 42.6 | 108.3 |
| 2012R | 32.58 | 524 | 1,804 | 1,275 | 48.3 | 119.0 |
| 2013 | 33.42 | 582 | 1,833 | 1,249 | 60.7 | 137.9 |
| Change 2004–2010 | 27% | 27% | 22% | 20% | 20% | 29% |
| Mtoe (million tonnes of oil equivalent) = 11.63 TWh (terawatt-hours). Primary energy includes energy losses. 2012R: CO2 calculation criteria changed; numbers updated. | ||||||
Oil production

In 2008, Iraq was the 9th highest crude oil exporter with 88 Mt.[4]
Oil provided 85% of government income. Iraq's oil reserves were the third biggest in the world, after Saudi Arabia and Iran. In 2009 the Iraq government set a target to increase oil production from 2.5-million-barrels (400,000 m3) to 7-million-barrels-per-day (1,100,000 m3/d) in six years. In June 2009 oil production rights in the Rumaila oil field were sold to BP and China National Petroleum[5][6] for 20 years contracts. Investments are estimated as $10–20 billion. Field reserves are 16.998 billion barrels (2.7025×10⁹ m3). In October 2009 Rumaila’s capacity was 1.1 million barrels per day (170,000 m3/d). Iraq's total oil production was 2.4 Mbbl/d (380,000 m3/d).[7]
A second auction took place in December 2009, and Iraq sold rights to seven oil fields for 20 years, increasing oil production 4.7 million barrels per day (750,000 m3/d) in future. The production companies will receive between $1 and $5.5 per barrel produced:[5][6]
- West Qurna Field 13-million-barrels (2,100,000 m3) oil: Lukoil 85% and StatoilHydro 15%
- Majnoon oil field 13-million-barrels (2,100,000 m3) oil: Shell and Petronas
- Halfaya Field: CNPC (Petronas / Total)
- Qaiyarah and Najmah field: Sonangol
- Garraf field: Petronas ja Japan Petroleum Exploration Company Limited JAPEX
- Badra field: Gazprom, Petronas, Korea Gas Corporation (KOGAS) ja TPAO
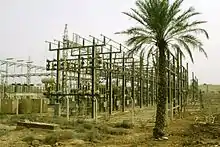
Electricity
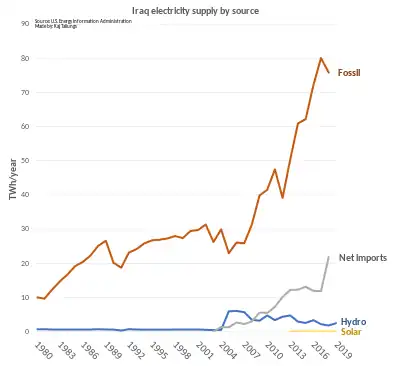
Over 80% of electricity in Iraq is generated by fossil fuels. As of 2023 the 30 gigawatts (GW) of installed capacity cannot meet summer peak demand.[8]
According to the United States Department of Energy officials, demand for electricity has been stimulated by a growing economy and a surge in consumer purchases of appliances and electronics.[9] In addition, electricity is subsidized in Iraq, which leads to increased demand.[8]
Due to a weak grid and institutional problems many consumers use small generators or rooftop solar panels.[8]Gas
Flaring is a problem.[10]
Policy
Oil revenues are the major income in the economy of Iraq.
Based on data from BP at the end of 2009 the highest proved oil reserves including the non-conventional oil deposits are in 1) Saudi Arabia (18 per cent of global reserves) 2) Canada (12%, mostly oil sands) 3) Venezuela (12%, mostly tar sands) 4) Iran (9%) and 5) Iraq (8%)[11]
Oil prices
Iraq is a member of OPEC.
The global oil and gas prices have been strongly influenced by political decisions and events. For example, the oil embargo 1967 and 1973 oil crisis during the 1970s, the Iran-Iraq War in the 1980s, the Iraq-Kuwait War in the 1990s and the Iraq War from 2003.[11]
Corruption risks
One of the corruption risks is that the oil resources are publicly owned but often privately produced. The complex system of licenses and fees may drive corruption incentives. According to Transparency International Bribe Payers Index 2008, the oil and gas industry in general is highly vulnerable to 1) bribery of public officials and 2) undue influence on the legislative process and government policies. IMF Working Paper confirms the relationship between oil rents and corruption. Higher increases in oil rents tends to increase corruption and erode political rights. Open Budget Survey 2008 by International Budget Partnership confirmed that the oil- and gas-dependent countries tend to be less transparent.[12]
See also
References
- "Iraq - Countries & Regions". IEA. Retrieved 2022-02-16.
- IEA Key World Energy Statistics Statistics 2015 Archived 2016-03-04 at the Wayback Machine, 2014 (2012R as in November 2015 Archived 2015-04-05 at the Wayback Machine + 2012 as in March 2014 is comparable to previous years statistical calculation criteria, 2013 Archived 2014-09-02 at the Wayback Machine, 2012 Archived 2013-03-09 at the Wayback Machine, 2011 Archived 2011-10-27 at the Wayback Machine, 2010 Archived 2010-10-11 at the Wayback Machine, 2009 Archived 2013-10-07 at the Wayback Machine, 2006 Archived 2009-10-12 at the Wayback Machine IEA October, crude oil p.11, coal p. 13 gas p. 15
- "Country Analysis Brief: Iraq". US Energy Information Administration. 28 April 2016. Retrieved 6 May 2016.
- IEA Key statistics 2010
- Irak huutokauppasi seitsemän öljykenttää yle 12.12.2009
- Irak huutokauppaa öljykenttiä yle 11.12.2009
- Rasheed, Ahmed (8 October 2009). "Iraq signs deal with BP, CNPC for Rumaila field". Reuters.
- "Iraq needs renewables, but they won't solve its power problems without broader reforms". Middle East Institute. Retrieved 2023-05-05.
- Rebuilding Iraq (PDF) (Report). United States Government Accountability Office. May 2007. p. 34.
- Global Gas Flaring Tracker Report (PDF) (Report). March 2023.
- 2011 report on oil and gas companies, Promoting revenue Transparency Archived 2011-06-02 at the Wayback Machine Transparency International 2011 page 113
- 2011 report on oil and gas companies, Promoting revenue Transparency Archived 2011-06-02 at the Wayback Machine Transparency International 2011 page 117